Pitney Bowes 2004 Annual Report Download - page 29
Download and view the complete annual report
Please find page 29 of the 2004 Pitney Bowes annual report below. You can navigate through the pages in the report by either clicking on the pages listed below, or by using the keyword search tool below to find specific information within the annual report.
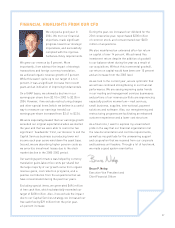
We enjoyed a good year in
2004. We met our financial
objectives, made significant
progress toward our strategic
imperatives, and successfully
complied with the rigorous
Sarbanes-Oxley requirements.
We grew our revenue by 8 percent. More
importantly, if we subtract the impact of strategic
transactions and foreign currency translation,
we achieved organic revenue growth of 3 percent.
While this wasn’t quite up to our target of 4 to 6
percent, it was a significant increase from recent
years and an indication of improving fundamentals.
On a GAAP basis, we showed a decline in our
earnings per share from $2.10 in 2003 to $2.05 in
2004. However, if we exclude restructuring charges
and other special items (which we believe is a useful
way to measure our earnings trends) our
earnings per share increased from $2.41 to $2.54.
We were especially pleased that our earnings growth
exceeded our original expectations when we started
the year and that we were able to overcome two
significant “headwinds.”First, our decision to exit the
Capital Services business is producing lower net
income each year as we wind down the asset base.
Second, we are absorbing higher pension costs as
we amortize investment losses due to the stock
market decline in the 2000-2002 period.
Our earnings performance was helped by currency
translation gains (about five cents per share) but
the large majority of our growth came from organic
revenue gains, cost reduction programs, and a
positive contribution from the acquisitions that we
have consummated during the past four years.
Excluding special items, we generated $694 million
of free cash flow, which substantially exceeded our
target of $600 million. Also, if we exclude the impact
due to our Capital Services strategy, we increased our
free cash flow by $29 million from the prior year,
a 6 percent increase.
During the year, we increased our dividend for the
23rd consecutive year, repurchased $200 million
of common stock, and consummated over $400
million of acquisitions.
We also maintained an unlevered after-tax return
on capital of over 14 percent. We achieved this
investment return despite the addition of goodwill
to our balance sheet during the year as a result of
our acquisitions. Without this incremental goodwill,
our return on capital would have been over 15 percent
and an increase from the 2003 level.
As we look to the current year, we are optimistic that
we will see continued strengthening in our financial
performance. We are seeing improving sales trends
in our mailing and management services businesses
and portions of our revenue portfolio are experiencing
especially positive momentum—mail services,
small business, supplies, international, payment
solutions and software. Also, our reengineering and
restructuring programs are facilitating an enhanced
customer experience and a lower cost structure.
As a final note, I want to express my unvarnished
pride in the way that our financial organization met
the new documentation and controls requirements,
as well as my gratitude for the unwavering support
and cooperation that we received from our corporate
and business unit leaders. Through a lot of hard work,
we made a good system even better.
Bruce P. Nolop
Executive Vice President and
Chief Financial Officer
FINANCIAL HIGHLIGHTS FROM OUR CFO
27


