Pepsi 2011 Annual Report Download - page 9
Download and view the complete annual report
Please find page 9 of the 2011 Pepsi annual report below. You can navigate through the pages in the report by either clicking on the pages listed below, or by using the keyword search tool below to find specific information within the annual report.-
 1
1 -
 2
2 -
 3
3 -
 4
4 -
 5
5 -
 6
6 -
 7
7 -
 8
8 -
 9
9 -
 10
10 -
 11
11 -
 12
12 -
 13
13 -
 14
14 -
 15
15 -
 16
16 -
 17
17 -
 18
18 -
 19
19 -
 20
20 -
21
-
22
-
23
-
24
-
25
-
26
-
27
-
28
-
29
-
30
-
31
-
32
-
33
-
34
-
35
-
36
-
37
-
38
-
39
-
40
-
41
-
42
-
43
-
44
-
45
-
46
-
47
-
48
-
49
-
50
-
51
-
52
-
53
-
54
-
55
-
56
-
57
-
58
-
59
-
60
-
61
-
62
-
63
-
64
-
65
-
66
-
67
-
68
-
69
-
70
-
71
-
72
-
73
-
74
-
75
-
76
-
77
-
78
-
79
-
80
-
81
-
82
-
83
-
84
-
85
-
86
-
87
-
88
-
89
-
90
-
91
-
92
 |
 |

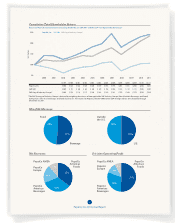
Net Revenues
PepsiCo
Americas
Foods
PepsiCo
Europe
PepsiCo
Americas
#FWFSBHFT
1FQTJ$P".&"
20%
11%
Division Operating Profit
PepsiCo
Americas
Foods
PepsiCo
Europe
PepsiCo
Americas
#FWFSBHFT
1FQTJ$P".&"
11%
8%
Mix of Net Revenue
48%
Food
#FWFSBHF
0VUTJEF
the U.S.
U.S.
5IF41"WFSBHFPG*OEVTUSZ(SPVQTJTEFSJWFECZXFJHIUJOHUIFSFUVSOTPGUXPBQQMJDBCMF41*OEVTUSZ(SPVQT/PO"MDPIPMJD#FWFSBHFTBOE'PPE
CZ1FQTJ$PTTBMFTJOJUTCFWFSBHFTBOEGPPETCVTJOFTTFT5IFSFUVSOTGPS1FQTJ$PUIF41BOEUIF41"WFSBHFJOEJDFTBSFDBMDVMBUFEUISPVHI
%FDFNCFS
12/99 12/00 12/01 12/02 12/04 12/06 12/07 12/08 12/09 12/10 12/11
PepsiCo, Inc. $100 $142 $140 $198 $181 $208 $241
41 $100 $ 91 $ 80 $ 62 $ 80 $ 89 $108 $114 $ 72 $ 91 $107
41"WHPG*OEVTUSZ(SPVQT $100 $118 $117 $161 $179 $148 $179 $210
Cumulative Total Shareholder Return
3FUVSOPO1FQTJ$PTUPDLJOWFTUNFOUJODMVEJOHEJWJEFOETUIF41®BOEUIF41® Average of Industry Groups*
50
100
150
200
250
201120102009200820072006200520042003200220012000
U.S. Dollars
PepsiCo, Inc. 41 41"WHPG*OEVTUSZ(SPVQT
PepsiCo, Inc. Annual Report