Pepsi 2011 Annual Report Download - page 5
Download and view the complete annual report
Please find page 5 of the 2011 Pepsi annual report below. You can navigate through the pages in the report by either clicking on the pages listed below, or by using the keyword search tool below to find specific information within the annual report.-
 1
1 -
 2
2 -
 3
3 -
 4
4 -
 5
5 -
 6
6 -
 7
7 -
 8
8 -
 9
9 -
 10
10 -
 11
11 -
 12
12 -
 13
13 -
 14
14 -
 15
15 -
 16
16 -
17
-
18
-
19
-
20
-
21
-
22
-
23
-
24
-
25
-
26
-
27
-
28
-
29
-
30
-
31
-
32
-
33
-
34
-
35
-
36
-
37
-
38
-
39
-
40
-
41
-
42
-
43
-
44
-
45
-
46
-
47
-
48
-
49
-
50
-
51
-
52
-
53
-
54
-
55
-
56
-
57
-
58
-
59
-
60
-
61
-
62
-
63
-
64
-
65
-
66
-
67
-
68
-
69
-
70
-
71
-
72
-
73
-
74
-
75
-
76
-
77
-
78
-
79
-
80
-
81
-
82
-
83
-
84
-
85
-
86
-
87
-
88
-
89
-
90
-
91
-
92
 |
 |

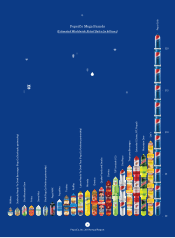
t We are creating mega brands that consumers
love around the world. In 20, weannounced
UIBUUISFFCSBOET%JFU.PVOUBJO%FX#SJTL
and Starbucks ready-to-drink beverages — had
each grown to more than $1billion in annual
retail sales, expanding PepsiCo’s portfolio of
billion-dollar brands to 22. That number is double
XIBUJUXBTĊĊZFBSTBHP0VSCSBOETBSFUZQJDBMMZ
number one or number two in their respective
categories. Importantly, Lay’s is the number
one global food brand, and Pepsi is one of the
world’s leading consumer brands. We will con-
tinue to drive growth and protability through
all of our mega brands — including the 12 core
CSBOETBTXFMMBTNPSFUIBOPUIFSCSBOET
in our portfolio with annual retail sales between
̓NJMMJPOBOE̓CJMMJPO
t We are extremely well-positioned to
grow — by category, region and trend.
Snacks, beverages and nutritional categories
all have attractive growth, margins and returns,
and are projected to grow revenue globally at
̓QFSDFOUPSIJHIFS8FCFMJFWFPVSCVTJOFTTFT
will continue to benet from favorable global
trends, including on-the-go lifestyles and a
rapidly growing middle class in emerging and
developing markets.
t We are innovating globally by delighting
locally. In 20, we continued to innovate by
leveraging our global platforms such as Lay’s
1PUBUP$IJQTXJUIMPDBMøBWPSTFYQBOEJOHPVS
baked grain snacks, rolling out Gatorade G
Series and launching brands geared to local
tastes like Tropicana Pulp Sacs in China and
)SVTUFBNDSJTQCSFBETJO3VTTJB0VSCBMBODF
of global and local innovation has delivered
strong, sustained growth. In fact, our emerging
and developing markets revenue has grown
from $8billion to $22billion since 2006. In 20,
PVSBDRVJTJUJPOPG8JNN#JMM%BOO3VTTJBT
leading branded food and beverage company,
BTXFMMBTUIFBDRVJTJUJPOPG.BCFMBTVDDFTTGVM
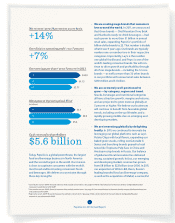
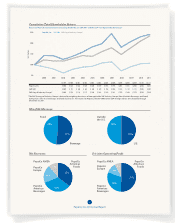
Net revenue1 grew 14 percent on a core basis.
+14%
Core division operating profit1 rose 7 percent.
+7%
Core earnings per share2 grew 7 percent in 2011.
11 $4.40
10 $4.13
09 $3.71
Management Operating Cash Flow
(in billions)
11 $6.1
10 $6.9
09 $5.6
Cash returned to shareholders
$5.6 billion
1$PSFSFTVMUTBSFOPO(""1öOBODJBMNFBTVSFTUIBUFYDMVEFDFSUBJOJUFNT4FFQBHFToGPSSFDPODJMJBUJPOTUPUIFNPTUEJSFDUMZDPNQBSBCMFöOBODJBM
measures in accordance with GAAP.
2 Core results are non-GAAP nancial measures that exclude certain items. See page 41 for a reconciliation to the most directly comparable nancial measure
in accordance with GAAP.
Represents a non-GAAP nancial measure that excludes certain items. See page 48 for a reconciliation to the most directly comparable nancial
measure in accordance with GAAP.
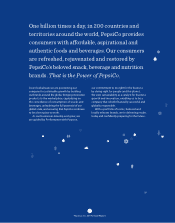
Today, PepsiCo is a global powerhouse, the largest
food and beverage business in North America
BOEUIFTFDPOEMBSHFTUJOUIFXPSME0VSNJTTJPO
is clear: to captivate consumers with the world’s
most loved and best-tasting convenient foods
and beverages. We deliver on our mission through
these key strengths:
PepsiCo, Inc. Annual Report