Oki 2009 Annual Report Download - page 9
Download and view the complete annual report
Please find page 9 of the 2009 Oki annual report below. You can navigate through the pages in the report by either clicking on the pages listed below, or by using the keyword search tool below to find specific information within the annual report.-
 1
1 -
 2
2 -
 3
3 -
 4
4 -
 5
5 -
 6
6 -
 7
7 -
 8
8 -
 9
9 -
 10
10 -
 11
11 -
 12
12 -
 13
13 -
 14
14 -
 15
15 -
 16
16 -
 17
17 -
 18
18 -
 19
19 -
 20
20 -
21
-
22
-
23
-
24
-
25
-
26
-
27
-
28
-
29
-
30
-
31
-
32
-
33
-
34
-
35
-
36
-
37
-
38
-
39
-
40
-
41
-
42
-
43
-
44
-
45
-
46
-
47
-
48
-
49
-
50
-
51
-
52
 |
 |

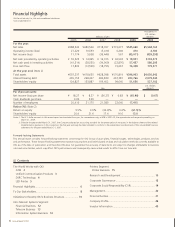
Annual Report 2009 7
Net Income (Loss) / Return on Equity (ROE)
Free Cash Flow
800
600
400
200
0
20092005 2006 2007 2008
688.5 680.5 718.8719.7
545.7
0.1%
4.0%
1.6%
–0.8%
0.9%
(Billions of yen)
(ended March 31)
20
0
–20
–40
–60
20092005 2006 2007 2008
11.2
5.1 0.6
–36.4
–45.0
9.5%3.9%
–61.5%
0.6%
–30.0%
(Billions of yen)
(ended March 31)
90
60
30
0
–30
20092005 2006 2007 2008
76.4
17.8
–13.6 –18.8
19.7
(Billions of yen)
(ended March 31)
Shareholders’ Equity / Shareholders’ Equity Ratio
160
120
80
40
0
20092005 2006 2007 2008
51.7
124.8133.9
109.4
94.6
13.0%
20.4%21.6%
17.4%16.6%
(Billions of yen)
(ended March 31)
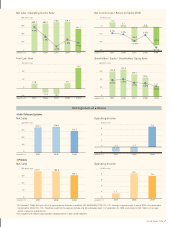
쎲Info-Telecom Systems
Net Sales
OKI Segments at a Glance
400
300
200
100
0
20092007 2008
352.7 359.0
302.3
(Billions of yen)
(ended March 31)
쎲
Operating Income
쎲Printers
Net Sales
160.7
187.1 185.8
200
150
100
50
0
20092007 2008
(Billions of yen)
(ended March 31)
쎲
Operating Income
10
6
4
2
0
20092007 2008
(Billions of yen)
(ended March 31)
1.7
8.6
7.8
8
*On October 1, 2008, OKI spun off of its semiconductor business to establish OKI SEMICONDUCTOR CO., LTD. through a company split, in which 95% of its share were
transferred to ROHM CO., LTD. Therefore results for this segment include only those between April 1 to September 30, 2008, amounting to ¥54.1 billion of net sales
and ¥5.1 billion of operating loss.
*Not included with the principal segments reviewed above is OKI’s Other segment.
8
6
2
4
–2
20092007 2008
(Billions of yen)
0
(ended March 31)
–1.5 –1.7
7.0
Net Sales / Operating Income Ratio