Oki 2009 Annual Report Download - page 13
Download and view the complete annual report
Please find page 13 of the 2009 Oki annual report below. You can navigate through the pages in the report by either clicking on the pages listed below, or by using the keyword search tool below to find specific information within the annual report.-
 1
1 -
2
-
 3
3 -
 4
4 -
 5
5 -
 6
6 -
 7
7 -
 8
8 -
 9
9 -
 10
10 -
 11
11 -
 12
12 -
 13
13 -
 14
14 -
 15
15 -
 16
16 -
 17
17 -
 18
18 -
 19
19 -
 20
20 -
 21
21 -
 22
22 -
 23
23 -
24
-
25
-
26
-
27
-
28
-
29
-
30
-
31
-
32
-
33
-
34
-
35
-
36
-
37
-
38
-
39
-
40
-
41
-
42
-
43
-
44
-
45
-
46
-
47
-
48
-
49
-
50
-
51
-
52
 |
 |

Annual Report 2009 11
쎲Reduction of cash outflows:
Undertake operations within the Group by effectively utilizing personnel and make efficient use of investments
쎲Corporate streamlining:
Review and share common functions in accordance with the new structure following the transfer of semiconductor
subsidiary shares
쎲Eliminate and integrate subsidiaries (including production bases):
Generate new businesses, provide comprehensive services and efficiently operate businesses through integration
쎲Reduce personnel costs:
Implement measures—including urgent actions—in response to deteriorating economic conditions
Strong Business Development:
Focusing on the info-telecom convergence and mechatronics businesses, OKI will rebuild differentiated competitiveness
through the following initiatives:
쎲Reexamine Group resources (personnel, goods, business, technological, product, and other) to synthesize, integrate and
pair these based on effective resource utilization
쎲Proactively utilize alliances formed with global partners
*Detailed information regarding these efforts is presented for each business segment beginning on page 12.
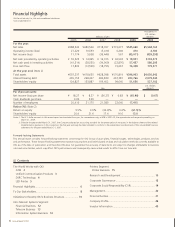
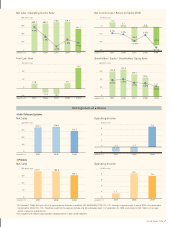
Basic Strategy
3Develop Strong Businesses Based on Strong Products
718.8
573.3
719.7
581.5 545.7 491.6
Net Sales
(Billions of yen)
2007(ended March 31) 20082009
왎Overall 왎Excluding Semiconductors
– 5.4 – 6.1
6.2
2.4
0.4
5.5
Operating Income
(Billions of yen)
왎Overall 왎Excluding Semiconductors
2007(ended March 31) 20082009
Free Cash Flow
(Billions of yen)
–18.8
19.7
76.4
2007 20082009
(ended March 31)
2007 20082009
(as of March 31)
628.4 570.8
397.0
Total Assets
(Billions of yen)
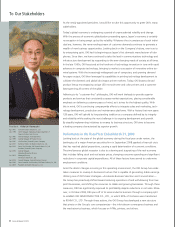
Fiscal year ended March 31, 2009 marks the year in which OKI completed the formulation
of its fully restructured business foundation.
From the fiscal year ending March 31, 2010 onward, OKI will work to develop businesses
that exemplify its identity more fully.
284.8267.4
203.8
2007 20082009
(as of March 31)
Interest-Bearing Debt
(Billions of yen)
Cash and Cash Equivalents
(Billions of yen)
49.849.8
64.4
2007 20082009
(as of March 31)
Shifts in Key Figures Due to Restructuring Measures