Occidental Petroleum 2006 Annual Report Download - page 14
Download and view the complete annual report
Please find page 14 of the 2006 Occidental Petroleum annual report below. You can navigate through the pages in the report by either clicking on the pages listed below, or by using the keyword search tool below to find specific information within the annual report.-
 1
1 -
2
-
3
-
 4
4 -
 5
5 -
 6
6 -
 7
7 -
 8
8 -
 9
9 -
 10
10 -
 11
11 -
 12
12 -
 13
13 -
 14
14 -
 15
15 -
 16
16 -
 17
17 -
 18
18 -
 19
19 -
 20
20 -
 21
21 -
 22
22 -
 23
23 -
 24
24 -
25
-
26
-
27
-
28
-
29
-
30
-
31
-
32
-
33
-
34
-
35
-
36
-
37
-
38
-
39
-
40
-
41
-
42
-
43
-
44
-
45
-
46
-
47
-
48
-
49
-
50
-
51
-
52
-
53
-
54
-
55
-
56
-
57
-
58
-
59
-
60
-
61
-
62
-
63
-
64
-
65
-
66
-
67
-
68
-
69
-
70
-
71
-
72
-
73
-
74
-
75
-
76
-
77
-
78
-
79
-
80
-
81
-
82
-
83
-
84
-
85
-
86
-
87
-
88
-
89
-
90
-
91
-
92
-
93
-
94
-
95
-
96
-
97
-
98
-
99
-
100
-
101
-
102
-
103
-
104
-
105
-
106
-
107
-
108
-
109
-
110
-
111
-
112
-
113
-
114
-
115
-
116
-
117
-
118
-
119
-
120
-
121
-
122
-
123
-
124
-
125
-
126
-
127
-
128
-
129
-
130
-
131
-
132
-
133
-
134
-
135
-
136
-
137
-
138
-
139
 |
 |

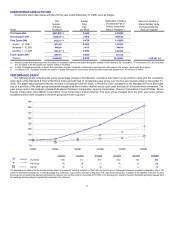
Debt Structure
Occidental's total debt and total debt-to-capitalization ratios are shown in the table below:
As shown, Occidental’s year-end 2006 total debt-to-capitalization ratio declined to 13 percent from the 43-percent level that existed at the end of
2002. The decrease in the total debt-to-capitalization ratio in 2006 compared with 2002 resulted from total debt reductions of 39 percent combined
with an increase in stockholders' equity of 204 percent over the same period.
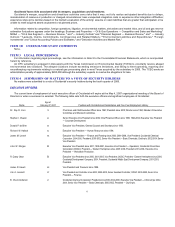
Since the second quarter of 2005, Occidental’s long-term senior unsecured debt has been rated A- by Standard and Poor’s Corporation, A3 by
Moody’s Investors Service, A- by Fitch Ratings and A(Low) by Dominion Bond Rating Service. A security rating is not a recommendation to buy,
sell or hold securities, may be subject to revision or withdrawal at any time by the assigning rating organization and should be evaluated
independently of any other rating.
Return on Equity
Occidental has focused on achieving top quartile return on equity. In 2006, Occidental's return on equity was 24 percent and the three-year
average return on equity was 30 percent. During the same three-year period, Occidental increased its stockholders’ equity by 142 percent and its
quarterly dividend by 60 percent while its stock price increased by 131 percent.
Business Environment
Oil and gas prices are the major variables that drive the industry’s short and intermediate term financial performance. Average yearly oil
prices strengthened in 2006 over 2005 levels but ended the year even with 2005 year-end levels. During the year, Occidental experienced an
increase in its price differential between the average West Texas Intermediate (WTI) price and Occidental's realized prices. Occidental’s realized
price as a percentage of WTI was approximately 85 percent and 87 percent for 2006 and 2005, respectively. Prices and differentials can vary
significantly, even on a short-term basis, making it difficult to forecast realized prices. The average WTI market price for 2006 was $66.23 per barrel
compared with $56.56 per barrel in 2005. Occidental's average realized price for oil in 2006 was $56.57, compared with $49.18 in 2005.
The average NYMEX domestic natural gas prices decreased approximately 4 percent from 2005. For 2006, NYMEX gas prices averaged
$7.82/Mcf compared with $8.11/Mcf for 2005.
Business Review
All production and reserve figures are net to Occidental unless otherwise specified.
Worldwide Production
Acquisitions
In January 2006, Occidental completed the merger of Vintage into a wholly-owned Occidental subsidiary. As a result, Occidental acquired
assets in Argentina, California, Yemen, Bolivia and the Permian Basin in Texas. See the applicable sections below for further information.
Occidental paid $1.3 billion in cash to former Vintage shareholders, issued approximately 56 million shares of Occidental common stock, which
were valued at $2.1 billion, and assumed Vintage’s debt, which had an estimated fair value of $585 million at closing. During 2006, Occidental
divested a portion of Vintage’s assets for consideration of approximately $1.0 billion.
In September 2006, Occidental acquired oil and gas assets from Plains for $859 million. The principal properties acquired are adjacent to
Occidental’s existing operations in California and the Permian Basin in west Texas.