Navy Federal Credit Union 2009 Annual Report Download - page 25
Download and view the complete annual report
Please find page 25 of the 2009 Navy Federal Credit Union annual report below. You can navigate through the pages in the report by either clicking on the pages listed below, or by using the keyword search tool below to find specific information within the annual report.-
 1
1 -
2
-
3
-
4
-
5
-
6
-
7
-
8
-
9
-
10
-
11
-
12
-
13
-
14
-
 15
15 -
 16
16 -
 17
17 -
 18
18 -
 19
19 -
 20
20 -
 21
21 -
 22
22 -
 23
23 -
 24
24 -
 25
25 -
 26
26 -
 27
27 -
 28
28
 |
 |

ASC 825-10 also requires the disclosure of all significant concentrations of credit risk arising from financial
liabilities, whether from an individual counterparty or groups of counterparties. Navy Federal has assessed the
counterparty credit risk on the financial liabilities and has determined that there is no material impact on the
financial statements.
Note 17: Loan Securitizations
Navy Federal started securitizing Ginnie Mae mortgage loans, which are classified as mortgage loans awaiting
sale in the first quarter of 2008. Navy Federal retains servicing rights for these loans and holds the resulting
security in its available-for-sale portfolio. The securities are carried at fair value with changes recorded in Other
Comprehensive Income.
Navy Federal used a third party to value its securities which used a single cash flow stream model and
market prices to value the securities. The fair value of Navy Federal’s on-balance sheet securitizations at
December 31, 2009 and 2008 was $1.7 billion and $320.0 million.
The unpaid principal balance of the securitized loans was $1.6 billion at December 31, 2009 and $310.0
million at December 31, 2008. The delinquent loans associated with the securitized asset totaled $5.7 million
and $0.6 million for years-ended 2009 and 2008, respectively. At December 31, 2009 and 2008, the fair value
of the mortgage servicing rights associated with the securitized loans was $15.2 million and $4.3 million.
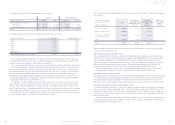
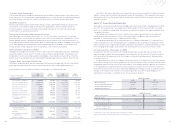
Key Assumptions at December 31, 2009
As required by ASC 860-10, Transfers and Servicing (formerly known as SFAS No. 166), the effect of two
negative changes in each of the key assumptions used to determine the fair value of its Ginnie Mae securities
must be disclosed. The negative effect of each change must be calculated independently, holding all other
assumptions constant.
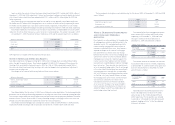
The tables below show the key assumptions used and the effect of a ten percent (10%) and twenty percent
(20%) adverse change to the constant prepayment rate (CPR) and discount factor. The adverse change reflects
the potential impact to the fair value of the securitizations if these changes occurred. However, the sensitivities
in the table below are hypothetical and may not be indicative of actual results. The effect of a variation in a
particular assumption on the fair value is calculated independently of changes in other assumptions. Further,
changes in fair value based on variations in assumptions generally cannot be extrapolated because the
relationship of the change in assumption on the fair value may not be linear.
(1) CPR is based on the average of the CPR for all of the Ginnie Mae securities.
(2) Ginnie Mae securities are explicitly backed by the federal government, therefore there are no anticipated credit losses.
27
2009 Financial Section
2009
Cash and Cash Equivalents
Cash and cash equivalents include cash and balances due from banks and credit unions, all of which mature
within ninety days. The carrying amount reported approximates fair value for vault cash and demand balances
from other financial institutions. Fair value for short-term securities is based on quoted market prices.
Members’ Accounts
The fair value of Share Savings, Money Market Savings, Checking and Individual Retirement Account (IRA)
share accounts is the amount payable on demand at the reporting date. For IRA Certificate and Share
Certificate accounts, fair value is estimated using the discounted value of future cash flows based upon
market interest rates and remaining maturity.
Derivative Instruments and Hedging Activities
Navy Federal does not receive loan commitment fees. The fair value of loan commitments is based upon
differences between the contracted rate and the current market rate of comparable mortgage loans. The fair
value of forward contracts is based on the quoted market price of contracts with similar characteristics. It is
the established practice of Navy Federal to only purchase forward contracts to cover mortgage loans in process
which are anticipated to close for delivery into these forward contracts. Accordingly, the cost to terminate
existing contracts, which is based on current market prices, is not material to Navy Federal.
Mortgage Servicing Rights (MSRs)
Mortgage servicing rights do not trade in an active, open market with readily observable prices. Accordingly,
Navy Federal obtains the fair value of the MSRs using a third-party pricing provider. The provider uses a
combination of market and income valuation methodologies. All assumptions are market driven. Once the
preliminary results are complete, they are further calibrated to observable market transactions, when they exist.
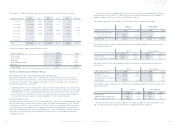
Federal Home Loan Bank (FHLB) Debt
FHLB debt is comprised of both short-term (operational) and long-term (strategic) debt. The Fair Value of FHLB
borrowings is based on the present value of future discounted cash flows using implied forward rates.
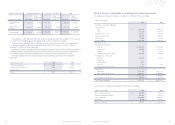
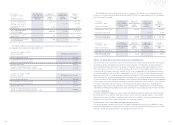
The estimated fair values of financial instruments at December 31, 2009 and 2008 were:
Navy Federal Credit Union
26
(dollars in thousands)
2009
Carrying Amount
2009
Fair Value
2008
Carrying Amount
2008
Fair Value
Financial Assets:
Cash and cash equivalents $ 854,984 $ 854,984 $ 534,401 534,401
Securities available-for-sale 3,852,246 3,852,246 2,631,256 2,631,256
Securities held-to-maturity 1,732,813 1,738,682 225,179 219,154
Interest-bearing deposits 12,056 12,056 31,626 31,626
Other investments 3,427 3,427 3,374 3,374
Investment in FHLB-Atlanta 379,641 379,641 376,435 376,435
Mortgage servicing assets 168,699 168,699 131,194 131,194
Mortgage loans awaiting sale 264,203 264,625 66,522 68,731
Other assets—derivative
commitments 5,555 5,555 5,380 5,380
Loans, net of allowance
for loan losses 30,500,611 31,499,520 30,585,853 31,027,296
Financial liabilities and equity:
Securities sold under
repurchase agreements 311,500 311,500 311,500 311,500
FHLB debt 6,842,685 7,048,477 7,809,672 7,819,835
Other liabilities—derivative
commitments 2,048 2,048 445 445
Members’ accounts 28,445,758 26,624,319 24,725,515 23,771,295
GNMA Mortgages
2009 2008
Discount factors 0.28–1.00 0.45–1.00
Constant prepayment rate(1) 10.7% 14.4%
Anticipated credit losses(2) $ — $ —
Weighted average life 5.63 years 5.11 years
GNMA Mortgages
(dollars in thousands) 2009 2008
Discount factor
Adverse change of 10% $ (166,566) $ (31,996)
Adverse change of 20% (333,133) (63,992)
Constant prepayment rate
Adverse change of 10% $ 473 $ (2,805)
Adverse change of 20% 750 (5,356)