National Grid 2004 Annual Report Download - page 22
Download and view the complete annual report
Please find page 22 of the 2004 National Grid annual report below. You can navigate through the pages in the report by either clicking on the pages listed below, or by using the keyword search tool below to find specific information within the annual report.-
 1
1 -
2
-
3
-
4
-
5
-
6
-
7
-
8
-
9
-
10
-
11
-
 12
12 -
 13
13 -
 14
14 -
 15
15 -
 16
16 -
 17
17 -
 18
18 -
 19
19 -
 20
20 -
 21
21 -
 22
22 -
 23
23 -
 24
24 -
 25
25 -
 26
26 -
 27
27 -
 28
28 -
 29
29 -
 30
30 -
 31
31 -
 32
32 -
33
-
34
-
35
-
36
-
37
-
38
-
39
-
40
 |
 |

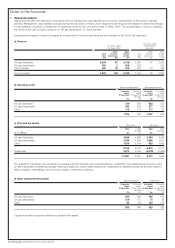
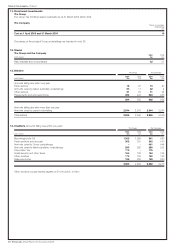
1. Segmental analysis
Segmental information is presented in accordance with the management responsibilities and economic characteristics of the Group’s business
activities. Management responsibilities changed during the year ended 31 March 2004. Segmental reporting has been aligned to reflect the changes
in responsibilities, resulting in a restatement of segmental results for the 12 months ended 31 March 2003. The principal effect of this is to reclassify
the results of the LNG Storage business from ‘UK gas transmission’ to ‘Other activities’.
A geographical analysis of results and assets is not provided as Transco’s operations are all undertaken in the UK for UK customers.
a) Turnover
12 months ended
12 months ended 31 March 2003
31 March 2004 Restated
Sales Sales Sales Sales
Total between to third Total between to third
sales businesses parties sales businesses parties
£m £m £m £m £m £m
UK gas distribution 2,245 87 2,158 2,089 47 2,042
UK gas transmission 560 2 558 552 – 552
Other activities 425 19 406 461 18 443
Group turnover 3,230 108 3,122 3,102 65 3,037
b) Operating profit
Before exceptional items After exceptional items
12 months 12 months 12 months 12 months
ended ended ended ended
31 Mar 2004 31 Mar 2003 31 Mar 2004 31 Mar 2003
Restated Restated
£m £m £m £m
UK gas distribution 729 554 653 443
UK gas transmission 283 269 277 250
Other 112 113 117 97
1,124 936 1,047 790
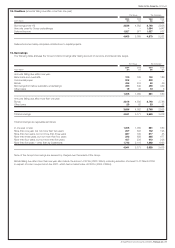
c) Total and net assets
Total assets Net assets
2004 2003 2004 2003
Restated Restated
at 31 March £m £m £m £m
UK gas distribution 4,928 4,998 3,403 3,480
UK gas transmission 2,166 1,883 1,889 1,571
Other 1,054 1,144 923 1,064
8,148 8,025 6,215 6,115
Unallocated 2,673 2,342 (4,078) (4,466)
10,821 10,367 2,137 1,649
The analysis of total assets and net assets by business segment excludes inter-business balances. Unallocated total assets include amounts owed
by fellow subsidiary undertakings, prepaid financing charges and current asset investments. Unallocated net liabilities include net amounts owed by
fellow subsidiary undertakings, net borrowings, taxation, interest and dividends.
d) Other segmental information
Capital expenditure Depreciation
12 months 12 months 12 months 12 months
ended ended ended ended
31 Mar 2004 31 Mar 2003 31 Mar 2004 31 Mar 2003
Restated Restated
£m £m £m £m
UK gas distribution 293 380 195 185
UK gas transmission 159 177 75 64
Other 83 89 153 136
535 646 423 385
Capital expenditure comprises additions to tangible fixed assets.
20 Transco plc_Annual Report and Accounts 2003/04
Notes to the Accounts