NEC 2015 Annual Report Download - page 13
Download and view the complete annual report
Please find page 13 of the 2015 NEC annual report below. You can navigate through the pages in the report by either clicking on the pages listed below, or by using the keyword search tool below to find specific information within the annual report.-
 1
1 -
2
-
 3
3 -
 4
4 -
 5
5 -
 6
6 -
 7
7 -
 8
8 -
 9
9 -
 10
10 -
 11
11 -
 12
12 -
 13
13 -
 14
14 -
 15
15 -
 16
16 -
 17
17 -
 18
18 -
 19
19 -
 20
20 -
 21
21 -
 22
22 -
 23
23 -
24
-
25
-
26
-
27
-
28
-
29
-
30
-
31
-
32
-
33
-
34
-
35
-
36
-
37
-
38
-
39
-
40
-
41
-
42
-
43
-
44
-
45
-
46
-
47
-
48
-
49
-
50
-
51
-
52
-
53
-
54
-
55
-
56
-
57
-
58
-
59
-
60
-
61
-
62
-
63
-
64
-
65
-
66
 |
 |

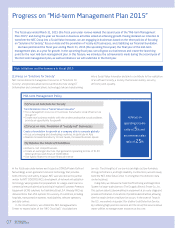
150.0
100.0
50.0
94.1
33.7
83.9
143.7
87.9
–38.9
–146.2
–101.7
–47.5
–49.7
55.2
–112.6
34.2 42.0
40.4
2011 2012 2013 2014 2015
–200.0
0
Operating Cash Flows, Investment
Cash Flows, Free Cash Flows
(Billion ¥)
Operating Cash Flows Investment Cash Flows
Free Cash Flows
300.0
600.0
900.0
695.9
757.1
657.0
710.7
823.7
27.5%
27.8%
28.8%
25.7%
31.4%
2011 2012 2013 2014 2015
0
Owner’s Equity, Owner’s Equity Ratio
(Billion ¥)
Owner’s Equity
Owner’s Equity Ratio
(At year-end)
0.8
0.6
0.4
0.2
0.57
0.53
0.62
0.67
0.41
2011 2012 2013 2014 2015
0
Net Debt-Equity Ratio
(times)
(At year-end)
NEC has achieved year-beginning targets for operating income and
net income for the past three years consecutively, including the
year under review, and is shaping a structure capably of recording
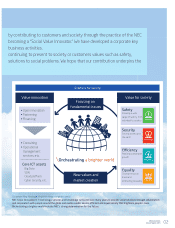
stable profits in addition to focusing on “Solutions for Society.” The
business plan for the year ending March 31, 2016, the final year of
the “Mid-term Management Plan 2015,” is to accelerate in strategic
investments necessary for NEC to enter its growth trajectory. This
will enable well-balanced business portfolio centered on sales and
earnings growth in target domains or overseas to grow, and achieve
better profitability and improved cash flows.
Noncurrent assets as of March 31, 2015 increased by ¥41.4
billion compared with the end of the previous fiscal year to
¥1,043.9 billion, mainly due to increased retirement benefit assets.
Total liabilities as of March 31, 2015 decreased by ¥1.2 billion
compared with the end of the previous fiscal year, to ¥1,736.5
billion. The balance of interest-bearing debt amounted to ¥520.8
billion, a decrease of ¥54.4 billion compared with the end of the
previous fiscal year. The debt-equity ratio as of March 31, 2015
was 0.63, an improvement of 0.20 points compared with the end of
the previous fiscal year. The balance of net interest-bearing debt as
of March 31, 2015, calculated by offsetting the balance of interest-
bearing debt with the balance of cash and cash equivalents,
amounted to ¥339.6 billion, a decrease of ¥28.9 billion compared
with the end of the previous fiscal year. The net debt-equity ratio
as of March 31, 2015 was 0.41, an improvement of 0.12 points
compared with the end of the previous fiscal year.
Total net assets were ¥884.2 billion as of March 31, 2015, an
increase of ¥116.5 billion compared with the end of the previous
fiscal year, mainly due to the recording of net income and an
increase in the remeasurements of defined benefit plans for the
fiscal year ended March 31, 2015.
As a result, the owner’s equity as of March 31, 2015 was ¥823.7
billion and owner’s equity ratio was 31.4%, an improvement of 3.6
points compared with the end of the previous fiscal year.
Net cash inflows from operating activities for the fiscal year
ended March 31, 2015 were ¥87.9 billion, a worsening of ¥6.2
billion compared with the previous fiscal year, mainly due to
worsened working capital.
Net cash outflows from investing activities for the fiscal year
ended March 31, 2015 were ¥47.5 billion, an increase of ¥8.6 billion
as compared with the previous fiscal year. This was mainly due to
increased outflows for business acquisitions, while in the same
period of the previous fiscal year, the acquisition of trust
beneficiary rights set to land and buildings of the NEC Group’s
Tamagawa business facilities was offset by cash inflows from the
gain on sales of subsidiaries and affiliates’ stocks.
As a result, free cash flows, the sum of cash flows from
operating activities and investing activities for the fiscal year
ended March 31, 2015 totaled a cash inflow of ¥40.4 billion, a
decrease of ¥14.8 billion year on year.
The NEC Group is preparing for the voluntary adoption of
International Financial Reporting Standards (IFRS) from the fiscal
year ending March 31, 2017, to enhance the international
comparability of its financial information in capital markets.
At NEC, we will continue with our initiatives in establishing a
strong finance foundation. In doing so, we aim to achieve initial
targets in the upcoming fiscal year, and to record results in
accordance with a year for growth.
Initiatives for Fiscal 2016
12
NEC Corporation
Annual Report 2015
Management Policies