Motorola 2000 Annual Report Download - page 33
Download and view the complete annual report
Please find page 33 of the 2000 Motorola annual report below. You can navigate through the pages in the report by either clicking on the pages listed below, or by using the keyword search tool below to find specific information within the annual report.-
 1
1 -
2
-
3
-
4
-
5
-
6
-
7
-
8
-
9
-
10
-
11
-
12
-
13
-
14
-
15
-
16
-
17
-
18
-
19
-
20
-
21
-
22
-
 23
23 -
 24
24 -
 25
25 -
 26
26 -
 27
27 -
 28
28 -
 29
29 -
 30
30 -
 31
31 -
 32
32 -
 33
33 -
 34
34 -
 35
35 -
 36
36
 |
 |

MOTOROLA, INC. AND SUBSIDIARIES 31
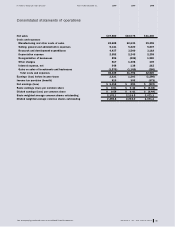
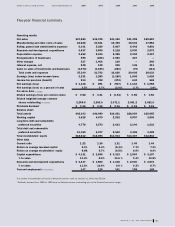
Five-year financial summary
Operating results
Net sales $37,580 $33,075 $31,340 $31,498 $29,657
Manufacturing and other costs of sales ÷23,628 ÷20,631 19,396 18,532 17,854
Selling, general and administrative expenses ÷5,141 ÷5,220 5,807 5,443 4,891
Research and development expenditures ÷4,437 ÷3,560 3,118 2,930 2,572
Depreciation expense ÷2,352 ÷2,243 2,255 2,394 2,367
Reorganization of businesses ÷596 ÷(226) 1,980 327 –
Other charges ÷517 ÷1,406 109 – 249
Interest expense, net ÷248 ÷138 215 136 211
Gains on sales of investments and businesses ÷(1,570) ÷(1,180) (260) (70) (113)
Total costs and expenses ÷35,349 ÷31,792 32,620 29,692 28,031
Earnings (loss) before income taxes ÷2,231 ÷1,283 (1,280) 1,806 1,626
Income tax provision (benefit) ÷913 ÷392 (373) 642 568
Net earnings (loss) $÷1,318 $««÷«891 $««÷(907) $««1,164 $««1,058
Net earnings (loss) as a percent of sales ÷3.5% ÷2.7% (2.9) % 3.7% 3.6%
Per share data (in dollars)
Diluted earnings (loss) per common share $««««0.58 $««««0.41 $«««(0.44) $««««0.56 $««««0.51
Diluted weighted average common
shares outstanding (in millions) ÷2,256.6 ÷2,202.0 2,071.1 2,091.2 2,081.0
Dividends declared 1$÷««0.16 $««÷0.16 $««÷0.16 $««÷0.16 $««÷0.15
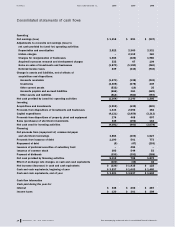
Balance sheet
Total assets $42,343 $40,489 $30,951 $28,954 $25,665
Working capital ÷3,628 ÷4,679 2,532 4,597 3,696
Long-term debt and redeemable
preferred securities ÷4,778 ÷3,573 2,633 2,144 1,931
Total debt and redeemable
preferred securities ÷11,169 ÷6,077 5,542 3,426 3,328
Total stockholders’ equity $18,612 $18,693 $13,913 $14,487 $12,843
Other data
Current ratio ÷1.22 ÷1.36 1.21 1.49 1.44
Return on average invested capital 6.3% 5.3% (5.4) % 7.7% 7.1%
Return on average stockholders’ equity ÷6.6%% ÷5.7% (6.5) % 8.5% 8.4%
Capital expenditures $««4,131 $««2,856 $««3,313 $««2,954 $««3,107
% to sales ÷11.0% ÷8.6% 10.6 % 9.4% 10.5%
Research and development expenditures $««4,437 $««3,560 $««3,118 $««2,930 $««2,572
% to sales ÷11.8% ÷10.8% ÷9.9 % 9.3% 8.7%
Year-end employment (in thousands) ÷147 ÷128 141 158 148
The number of stockholders of record of Motorola common stock on January 31, 2001 was 55,034.
1Dividends declared from 1996 to 1999 were on Motorola shares outstanding prior to the General Instrument merger.
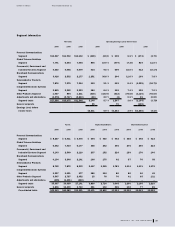
Dollars in millions, except as noted Years ended December 31 2000 1999 1998 1997 1996