Motorola 2000 Annual Report Download - page 31
Download and view the complete annual report
Please find page 31 of the 2000 Motorola annual report below. You can navigate through the pages in the report by either clicking on the pages listed below, or by using the keyword search tool below to find specific information within the annual report.-
 1
1 -
2
-
3
-
4
-
5
-
6
-
7
-
8
-
9
-
10
-
11
-
12
-
13
-
14
-
15
-
16
-
17
-
18
-
19
-
20
-
 21
21 -
 22
22 -
 23
23 -
 24
24 -
 25
25 -
 26
26 -
 27
27 -
 28
28 -
 29
29 -
 30
30 -
 31
31 -
 32
32 -
 33
33 -
 34
34 -
 35
35 -
 36
36
 |
 |

MOTOROLA, INC. AND SUBSIDIARIES 29
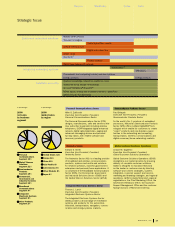
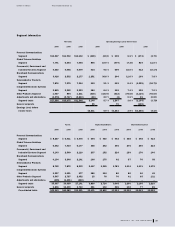
Segment information
Net Sales Operating Earnings (Loss) Before Taxes
2000 1999 1998 2000 1999 1998
Personal Communications
Segment $13,267 $11,932 $10,132 $÷(328) (2.5) % $÷«608 5.1 % $÷«(373) (3.7) %
Global Telecom Solutions
Segment ÷7,791 6,544 7,064 ÷846 10.9 % (479) (7.3) % 819 11.6 %
Commercial, Government and
Industrial Systems Segment ÷4,580 4,068 4,079 ÷434 9.5 % 609 15.0 % 412 10.1 %%
Broadband Communications
Segment ÷3,416 2,532 2,177 ÷1,251 36.6 % 294 11.6 % 169 7.8 %
Semiconductor Products
Segment ÷7,876 7,370 7,314 ÷163 2.1 % 619 8.4 % (1,225) (16.7) %
Integrated Electronic Systems
Segment ÷2,869 2,592 2,223 ÷184 6.4 % 192 7.4 % 155 7.0 %
Other Products Segment ÷1,057 804 1,211 (338) (32.0) % (632) (78.6) % (1,126) (93.0) %
Adjustments and eliminations (3,276) (2,767) (2,860) (66) 2.0 % (4) 0.1 % 15 (0.5) %
Segment totals $37,580 $33,075 $31,340 ÷2,146 5.7 % ÷1,207 3.6 % (1,154) (3.7) %%
General corporate 85 76 (126)
Earnings (loss) before
income taxes $2,231 5.9 % $1,283 3.9 % $(1,280) (4.1) %
Assets Capital Expenditures Depreciation Expense
2000 1999 1998 2000 1999 1998 2000 1999 1998
Personal Communications
Segment $÷8,287 $÷6,411 $÷5,476 $«««504 $«««450 $«««442 $«««388 $«««398 $«««422
Global Telecom Solutions
Segment 6,562 7,414 6,177 355 262 345 275 260 222
Commercial, Government and
Industrial Systems Segment 3,143 2,509 2,110 237 152 224 189 170 146
Broadband Communications
Segment 4,134 3,346 2,191 166 175 92 87 76 58
Semiconductor Products
Segment 8,762 7,872 8,232 2,407 1,505 1,783 1,134 1,131 1,178
Integrated Electronic Systems
Segment 1,327 1,151 977 186 104 86 86 66 63
Other Products Segment 3,597 2,787 2,452 25 76 76 91 65 121
Adjustments and eliminations (305) (1,401) (424) ––––––
Segment totals 35,507 30,089 27,191 3,880 2,724 3,048 2,250 2,166 2,210
General corporate 6,836 10,400 3,760 251 132 265 102 77 45
Consolidated totals $42,343 $40,489 $30,951 $4,131 $2,856 $3,313 $2,352 $2,243 $2,255
Dollars in millions Years ended December 31