ManpowerGroup 2007 Annual Report Download - page 7
Download and view the complete annual report
Please find page 7 of the 2007 ManpowerGroup annual report below. You can navigate through the pages in the report by either clicking on the pages listed below, or by using the keyword search tool below to find specific information within the annual report.-
 1
1 -
 2
2 -
 3
3 -
 4
4 -
 5
5 -
 6
6 -
 7
7 -
 8
8 -
 9
9 -
 10
10 -
 11
11 -
 12
12 -
 13
13 -
 14
14 -
 15
15 -
 16
16 -
 17
17 -
 18
18 -
19
-
20
-
21
-
22
-
23
-
24
-
25
-
26
-
27
-
28
-
29
-
30
-
31
-
32
-
33
-
34
-
35
-
36
-
37
-
38
-
39
-
40
-
41
-
42
-
43
-
44
-
45
-
46
-
47
-
48
-
49
-
50
-
51
-
52
-
53
-
54
-
55
-
56
-
57
-
58
-
59
-
60
-
61
-
62
-
63
-
64
-
65
-
66
-
67
-
68
-
69
-
70
-
71
 |
 |

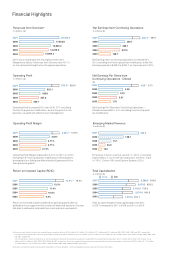
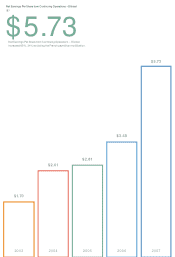
Net Earnings Per Share from Continuing Operations – Diluted
($)
2003 2004 2005 2006 2007
$1.70
$2.61
$2.81
$3.48
$5.73
$5.73
Net Earnings Per Share from Continuing Operations – Diluted
increased 65%, 34% excluding the French payroll tax modifi cation.