ManpowerGroup 2007 Annual Report Download - page 6
Download and view the complete annual report
Please find page 6 of the 2007 ManpowerGroup annual report below. You can navigate through the pages in the report by either clicking on the pages listed below, or by using the keyword search tool below to find specific information within the annual report.-
 1
1 -
 2
2 -
 3
3 -
 4
4 -
 5
5 -
 6
6 -
 7
7 -
 8
8 -
 9
9 -
 10
10 -
 11
11 -
 12
12 -
 13
13 -
 14
14 -
 15
15 -
 16
16 -
 17
17 -
18
-
19
-
20
-
21
-
22
-
23
-
24
-
25
-
26
-
27
-
28
-
29
-
30
-
31
-
32
-
33
-
34
-
35
-
36
-
37
-
38
-
39
-
40
-
41
-
42
-
43
-
44
-
45
-
46
-
47
-
48
-
49
-
50
-
51
-
52
-
53
-
54
-
55
-
56
-
57
-
58
-
59
-
60
-
61
-
62
-
63
-
64
-
65
-
66
-
67
-
68
-
69
-
70
-
71
 |
 |

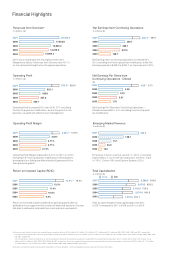
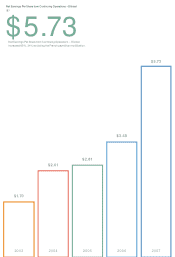
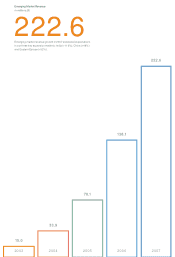
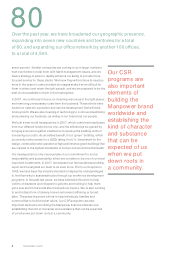
A closely watched metric within our company is our operating profi t
margin, which expanded 30 basis points to 3.3 percent, excluding the
favorable impact of the French payroll tax modifi cation. Our free cash
fl ow also improved dramatically to $341 million, a 22 percent increase.
The effi cient use of capital, coupled with the substantial increase in
operating profi t (excluding the impact of the payroll tax modifi cation),
yielded an increase in economic profi t of 52 percent.
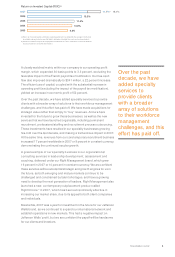
Over the past decade, we have added specialty services to provide
clients with a broader array of solutions to their workforce management
challenges, and this effort has paid off. We have made acquisitions for
strategic value rather than simply to “buy” revenues. And we have
invested for the future to grow these businesses, as well as the new
services that we have launched organically, including permanent
recruitment, professional staffi ng and recruitment process outsourcing.
These investments have resulted in our specialty businesses growing
fi ve-fold over the last decade, and making a tremendous impact in 2007.
At the same time, revenues from our core temporary recruitment business
increased 17 percent worldwide in 2007 or 9 percent in constant currency,
demonstrating the continued secular growth.
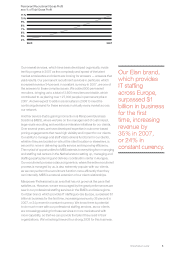
A great example of our specialty business is our organizational
consulting services in leadership development, assessment and
coaching, delivered under our Right Management brand, which grew
16 percent in 2007 or 10 percent in constant currency. We are confi dent
these services will be substantial strategic and growth engines for us in
the future, as both emerging and mature markets continue to be
challenged and constrained by talent shortages, and have a growing
need to develop the next generation of leaders. Right Management also
launched a new, contemporary outplacement product called
RightChoiceTM in 2007, which has been extraordinarily effective in
increasing our market share, due to its appeal to both client companies
and individuals.
Meanwhile, 2007 was a year for investment in the future for our Jefferson
Wells brand, as we continued to expand our international network and
establish operations in new markets. This had a negative impact on
Jefferson Wells’ profi t, but we are confi dent the payoff will be handsome
for our clients and investors.
Over the past
decade, we have
added specialty
services to
provide clients
with a broader
array of solutions
to their workforce
management
challenges, and this
effort has paid off.
3
Shareholder’s Letter
2006
2007
2005
2004
2003
13.3%
11.4%
9.8%
10.9%
18.0%
14.9%(b)
Return on Invested Capital (ROIC)(a)
(a) Return on Invested Capital is defi ned as operating profi t after tax divided by the average monthly total
of net debt and equity for the year. Net debt is defi ned as total debt less cash and cash equivalents.
(b) Amounts exclude the impact of the payroll tax modifi cation in France. (See Note 1 to the consolidated
fi nancial statements for further information.)