ManpowerGroup 2007 Annual Report Download - page 19
Download and view the complete annual report
Please find page 19 of the 2007 ManpowerGroup annual report below. You can navigate through the pages in the report by either clicking on the pages listed below, or by using the keyword search tool below to find specific information within the annual report.-
 1
1 -
2
-
3
-
4
-
5
-
6
-
7
-
8
-
 9
9 -
 10
10 -
 11
11 -
 12
12 -
 13
13 -
 14
14 -
 15
15 -
 16
16 -
 17
17 -
 18
18 -
 19
19 -
 20
20 -
 21
21 -
 22
22 -
 23
23 -
 24
24 -
 25
25 -
 26
26 -
 27
27 -
 28
28 -
 29
29 -
30
-
31
-
32
-
33
-
34
-
35
-
36
-
37
-
38
-
39
-
40
-
41
-
42
-
43
-
44
-
45
-
46
-
47
-
48
-
49
-
50
-
51
-
52
-
53
-
54
-
55
-
56
-
57
-
58
-
59
-
60
-
61
-
62
-
63
-
64
-
65
-
66
-
67
-
68
-
69
-
70
-
71
 |
 |
Management’s Discussion & Analysis16 Manpower 2007 Annual Report
Management’s Discussion & Analysis
of financial condition and results of operations
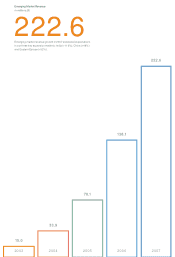
Net Earnings Per Share – Diluted increased 26.2% to $5.73 in 2007 compared to $4.54 in 2006. Net Earnings Per Share From
Continuing Operations – Diluted was $5.73 in 2007 compared to $3.48 in 2006. Included in 2007 Net Earnings is the impact of
the retroactive modifi cation to the payroll tax calculation in France which was an increase to Net Earnings of $88.6 million. This
represents a $1.05 increase in 2007 Net Earnings Per Share – Diluted. The higher foreign currency exchange rates favorably
impacted Net Earnings Per Share – Diluted by approximately $0.35 in 2007.
Weighted Average Shares – Diluted were 84.6 million in 2007 and 87.7 million in 2006. This decline is primarily a result of our
repurchase of 6.1 million shares of our common stock during 2007.
Consolidated Results – 2006 compared to 2005
Revenues from Services increased 10.8% to $17.6 billion. Revenues were positively impacted by changes in foreign currency
exchange rates during the period due to the weakening of the U.S. Dollar relative to the currencies in most of our non U.S.
markets. Revenues increased 10.0% in constant currency. This growth rate is a result of increased demand for our services in
most of our markets, including the U.S., France, EMEA, and Other Operations, where revenues increased 3.2%, 8.4%, 14.7%
and 13.8%, respectively, on a constant currency basis. We also saw solid growth in our permanent recruitment business which
increased 38.8% on a consolidated basis in constant currency.
Gross Profi t increased 11.1% to $3.1 billion in 2006. In constant currency, Gross Profi t increased 10.3%. The Gross Profi t
Margin was 17.9% in both 2006 and 2005. The following items impacted Gross Profi t Margin (along with the impact of each on
consolidated Gross Profi t Margin): an increase in our permanent recruitment business (+0.27%), an increase in Gross Profi t
Margin in the temporary recruitment business (+0.24%), a change in the mix of services provided (-0.35%), and the impact of a
2005 French payroll tax audit settlement (-0.12%). Temporary recruitment margins have increased as a result of improved
pricing in some markets, including France, and improved margins in other markets as a result of lower direct costs (such
as workers’ compensation and state unemployment taxes in the U.S.). The change in the mix of services is primarily due to a
relatively lower amount of revenues coming from Jefferson Wells and Right Management, where the Gross Profi t Margin is
generally higher than the Company average.
Selling and Administrative Expenses increased 8.8% during 2006, or 8.2% in constant currency. This increase is primarily in
response to the increase in business volumes, expensing the value of stock options for the fi rst time in 2006 ($15.8 million),
certain expenses related to reorganizations ($15.9 million) and global cost reduction project costs ($9.2 million). As a percent of
revenues, Selling and Administrative Expenses were 14.9% in 2006 compared to 15.2% in 2005, an improvement of 30 basis
points (0.3%). This improvement refl ects a favorable impact of our cost control efforts and productivity gains, as we have been
able to increase the billable hours from our temporary recruitment business as well as our permanent placements without a
similar increase in branch headcount. These improvements are offset by the impact of the reorganization charges and global
cost reduction project costs ($25.1 million, 0.14% of revenue) and our continued investments in new offi ces and the permanent
recruitment business in certain markets.
Operating Profi t increased 24.1% over 2005, with an Operating Profi t Margin of 3.0% compared to 2.7% in 2005. On a
constant currency basis, Operating Profi t increased 21.9%. The Operating Profi t Margin improvement refl ects the improvements
in Gross Profi t Margin and Selling and Administrative Expenses discussed above. The reorganization charges and global cost
reduction project costs accounted for a 4.7% reduction in Operating Profi t and a 0.14% decrease in Operating Profi t Margin.
Interest and Other Expense is comprised of interest, foreign exchange gains and losses, and other miscellaneous non-operating
income and expenses. Interest and Other Expense was expense of $50.2 million in 2006 compared to $41.8 million in 2005.
Net Interest Expense decreased to $35.8 million in 2006 from $36.9 million in 2005, primarily due to an increase in interest
income as a result of increased cash levels and investment rates. Foreign exchange gains and losses primarily result from
intercompany transactions between our foreign subsidiaries and the U.S. Foreign exchange losses were $3.2 million in 2006
compared to minimal gains in 2005. Miscellaneous Expense, Net, consists of bank fees and other non-operating expenses
and, in 2006, was $11.2 million compared to $4.9 million in 2005. Included in 2005 is a $2.6 million non-operating gain related
to an equity investment we sold in the fourth quarter of 2005.