ManpowerGroup 2007 Annual Report Download - page 3
Download and view the complete annual report
Please find page 3 of the 2007 ManpowerGroup annual report below. You can navigate through the pages in the report by either clicking on the pages listed below, or by using the keyword search tool below to find specific information within the annual report.-
 1
1 -
 2
2 -
 3
3 -
 4
4 -
 5
5 -
 6
6 -
 7
7 -
 8
8 -
 9
9 -
 10
10 -
 11
11 -
 12
12 -
 13
13 -
 14
14 -
15
-
16
-
17
-
18
-
19
-
20
-
21
-
22
-
23
-
24
-
25
-
26
-
27
-
28
-
29
-
30
-
31
-
32
-
33
-
34
-
35
-
36
-
37
-
38
-
39
-
40
-
41
-
42
-
43
-
44
-
45
-
46
-
47
-
48
-
49
-
50
-
51
-
52
-
53
-
54
-
55
-
56
-
57
-
58
-
59
-
60
-
61
-
62
-
63
-
64
-
65
-
66
-
67
-
68
-
69
-
70
-
71
 |
 |

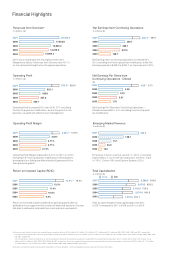
Financial Highlights
12,084.3
14,675.0
15,845.4
17,562.5
2006
2005
2004
2003
20,500.3
2007
Revenues from Services(a)
in millions ($)
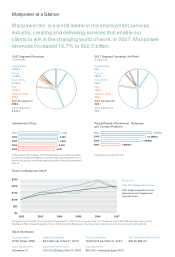
2007 was a record year with the highest revenues in
Manpower’s history. Revenues from Services rose 16.7%
on the continued strength of our European operations.
259.1
397.8
428.8
532.1
2006
825.4675.8(b)
2007
2005
2004
2003
Operating Profit
in millions ($)
Operating Profi t increased 55% over 2006, 27% excluding
the French payroll tax modifi cation, due to the growth in the
business, coupled with effective cost management.
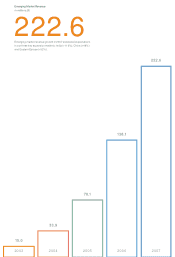
15.0
33.9
70.1
138.1
2006
222.6
2007
2005
2004
2003
Emerging Market Revenue
in millions ($)
Emerging market revenue growth in 2007 exceeded
expectations in our three key expansion markets: India
(+119%), China (+49%) and Eastern Europe (+52%).
(a) Revenues from Services includes fees received from our franchise offi ces of $26.5 million, $34.5 million, $35.8 million, $35.7 million and $35.7 million for 2003, 2004, 2005, 2006 and 2007, respectively.
These fees are primarily based on revenues generated by the franchise offi ces, which were $1,214.4 million, $1,487.1 million, $1,510.7 million, $1,497.0 million and $1,408.5 million for 2003, 2004, 2005, 2006
and 2007, respectively.
In the United States, where the majority of our franchises operate, Revenues from Services includes fees received from the related franchise operations of $21.9 million, $25.0 million, $24.9 million, $24.4
million and $24.2 million for 2003, 2004, 2005, 2006 and 2007, respectively. These fees are primarily based on revenues generated by the franchise operations, which were $1,026.2 million, $1,181.5 million,
$1,196.9 million, $1,146.1 million and $1,055.1 million for 2003, 2004, 2005, 2006 and 2007, respectively.
(b) Amounts exclude the impact of the payroll tax modifi cation in France. (See Note 1 to the consolidated fi nancial statements for further information.)
2.14%
2.71%
2.71%
3.03%2006
4.03%2007
2005
2004
2003
3.30% (b)
Operating Profi t Margin improved to 4.03% in 2007, or 3.30%
excluding the French payroll tax modifi cation refl ecting better
leveraging of our Selling and Administrative Expenses with the
strong revenue growth.
Operating Profit Margin
2,146.6 735.0
2,474.2 823.2
2006
2,669.3 914.5
2007
2005
2,174.0 901.82004
1,310.3 841.7
2003
Debt as a percentage of total capitalization was 26%
in 2007 compared to 25% in 2006 and 26% in 2005.
Total Capitalization
in millions ($)
equity debt
138.7
247.3
255.1
305.72006
484.72007
2005
2004
2003
396.1(b)
Net Earnings from Continuing Operations
in millions ($)
Net Earnings from Continuing Operations increased 59%,
30% excluding the French payroll tax modifi cation, while Net
Earnings grew from $398.0 to $484.7, an improvement of 22%.
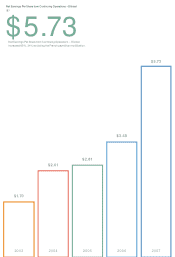
1.70
2.61
2.81
3.482006
5.73
2007
2005
2004
2003
4.68(b)
Net Earnings Per Share from
Continuing Operations - Diluted
($)
Net Earnings Per Share from Continuing Operations –
Diluted increased 65%, 34% excluding the French payroll
tax modifi cation.
2006
2007
2005
2004
2003
13.3%
11.4%
9.8%
10.9%
18.0%
14.9% (b)
Return on Invested Capital (ROIC)
Return on Invested Capital is defi ned as operating profi t after tax
divided by the average monthly total of net debt and equity for the year.
Net debt is defi ned as total debt less cash and cash equivalents.