ManpowerGroup 2007 Annual Report Download - page 20
Download and view the complete annual report
Please find page 20 of the 2007 ManpowerGroup annual report below. You can navigate through the pages in the report by either clicking on the pages listed below, or by using the keyword search tool below to find specific information within the annual report.-
 1
1 -
2
-
3
-
4
-
5
-
6
-
7
-
8
-
9
-
 10
10 -
 11
11 -
 12
12 -
 13
13 -
 14
14 -
 15
15 -
 16
16 -
 17
17 -
 18
18 -
 19
19 -
 20
20 -
 21
21 -
 22
22 -
 23
23 -
 24
24 -
 25
25 -
 26
26 -
 27
27 -
 28
28 -
 29
29 -
 30
30 -
31
-
32
-
33
-
34
-
35
-
36
-
37
-
38
-
39
-
40
-
41
-
42
-
43
-
44
-
45
-
46
-
47
-
48
-
49
-
50
-
51
-
52
-
53
-
54
-
55
-
56
-
57
-
58
-
59
-
60
-
61
-
62
-
63
-
64
-
65
-
66
-
67
-
68
-
69
-
70
-
71
 |
 |

17Management’s Discussion & Analysis Manpower 2007 Annual Report
We provided for income taxes from continuing operations at a rate of 36.6% in 2006 and 34.1% in 2005. The 2006 rate includes
the impact of certain non-recurring items in the fi rst quarter of 2006, including reorganization charges and costs related to our
global cost reduction project, and the impact of the reorganization charges in the fourth quarter of 2006. Excluding the impact
of these items, we provided for income taxes at a rate of 36.2% in 2006, which is higher than the U.S. Federal statutory rate
of 35% due primarily to the impact of higher foreign income tax rates, U.S. taxes on foreign earnings and U.S. state income
taxes. Included in the 2005 rate is the reversal of $14.4 million of valuation allowances, as a result of certain internal corporate
restructurings and transactions that were completed in 2005.
Net Earnings Per Share – Diluted increased 58.2% to $4.54 in 2006 compared to $2.87 in 2005. Net Earnings Per Share From
Continuing Operations – Diluted was $3.48 in 2006 compared to $2.81 in 2005. Foreign currency exchange rates favorably
impacted Net Earnings Per Share From Continuing Operations – Diluted by approximately $0.06 in 2006.
Weighted Average Shares – Diluted were 87.7 million in 2006 and 91.1 million in 2005. This decline is primarily a result of our
repurchase of 4.0 million shares of our common stock during 2006.
In January 2006, we sold a non-core payroll processing business in Sweden. In addition, in December 2006, we sold a
non-core facilities management services business in the Nordics. Pre-tax gains of $123.5 million ($89.5 million after tax, or
$1.02 per share – diluted) related to these sales were recorded in Income from Discontinued Operations in 2006. Net proceeds
received from the sales of these operations were $123.9 million. Also in December 2006, we recorded a net loss of $1.7 million
on the disposal of one of our Right Management subsidiaries. We have recorded these gains and losses, as well as the operating
results of these operations, as Income from Discontinued Operations in the consolidated statements of operations. (See Note
2 to the consolidated fi nancial statements for more information regarding discontinued operations).
Segment Results
United States – The U.S. operation is comprised of 555 Company-
owned branch offices and 282 stand alone franchise offices.
Revenues in the U.S. consist of sales of services by our Company-
owned branch offices and fees from our franchise operations.
Revenues for the year were $2.0 billion, a decrease of 7.2%, and
include franchise fees of $24.2 million. Franchise fees are primarily
based on revenues generated by the franchise network, which were
$1.1 billion in 2007.
Revenues contracted 5.2% in the first quarter of 2007 and then
showed further contraction throughout the year. The slowing demand
for our services was seen primarily in our core temporary recruitment
business as we experienced year-over-year declines in demand for
our light industrial and industrial skilled workers and for skilled offi ce
workers. The professional temporary recruitment business continued
to show improving revenue growth rates throughout 2007 with year-
over-year growth of 5.3%. Our permanent recruitment business
showed good growth throughout the year, with $38.1 million of
revenues, a 27.0% increase over 2006.
The Gross Profi t Margin increased compared to 2006 due to the increase in the permanent recruitment business as well as
improved margins from our temporary recruitment business, particularly in the fi rst half of the year, due primarily to lower workers’
compensation and state unemployment expenses. Acquisitions had a minimal impact on Gross Profi t Margin in 2007.
Selling and Administrative Expenses decreased 0.8% during the year primarily due to lower advertising costs due to the launch
of our new brand in 2006. Excluding acquisitions, Selling and Administrative Expenses decreased 2.4%.
Operating Unit Profi t (“OUP”) for the year decreased 8.3% to $80.1 million. OUP Margin was 4.1% of Revenues in 2007 and
2006. OUP Margin showed year-over-year improvement in the fi rst half of 2007 due to the higher Gross Profi t Margins. The
OUP Margin declined in the second half of 2007 despite the increase in Gross Profi t Margin due to the de-leveraging effect of
the revenue decline, as revenues have declined more than expenses. Acquisitions had a minimal impact on OUP Margin in
2007. (For the defi nition of OUP, refer to Note 15 of the consolidated fi nancial statements).
United States Revenues
in millions ($)
2,048.3
2,114.9
1,962.2
2007
2006
2005
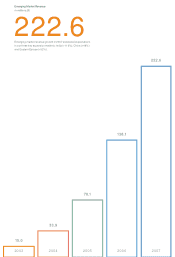
United States Operating Unit Profi t
in millions ($)
68.7
87.4
80.1
2007
2006
2005