Louis Vuitton 2002 Annual Report Download - page 7
Download and view the complete annual report
Please find page 7 of the 2002 Louis Vuitton annual report below. You can navigate through the pages in the report by either clicking on the pages listed below, or by using the keyword search tool below to find specific information within the annual report.-
 1
1 -
 2
2 -
 3
3 -
 4
4 -
 5
5 -
 6
6 -
 7
7 -
 8
8 -
 9
9 -
 10
10 -
 11
11 -
 12
12 -
 13
13 -
 14
14 -
 15
15 -
 16
16 -
 17
17 -
 18
18 -
19
-
20
-
21
-
22
-
23
-
24
-
25
-
26
-
27
-
28
-
29
-
30
-
31
-
32
-
33
-
34
-
35
-
36
-
37
-
38
-
39
-
40
-
41
-
42
-
43
-
44
-
45
-
46
-
47
-
48
-
49
-
50
-
51
-
52
-
53
-
54
-
55
-
56
-
57
-
58
-
59
-
60
-
61
-
62
-
63
-
64
-
65
-
66
-
67
-
68
-
69
-
70
-
71
-
72
-
73
-
74
-
75
-
76
-
77
-
78
-
79
-
80
-
81
-
82
-
83
-
84
-
85
-
86
-
87
-
88
-
89
-
90
-
91
-
92
-
93
-
94
-
95
-
96
-
97
-
98
-
99
-
100
-
101
-
102
-
103
-
104
-
105
-
106
-
107
-
108
 |
 |

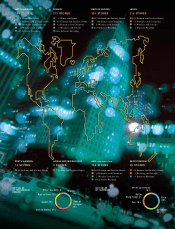
NORTH AM ERICA
346 STORES
■1 Wines and Spirits
■178 Fashion and Leather Goods
■16 Perfumes and Cosmetics
■6 Watches and Jew elry
■145 Selective Retailing
FRANCE
272 STORES
■4 Wines and Spirits
■62 Fashion and Leather Goods
■12 Perfumes and Cosmetics
■8 Watches and Jew elry
■186 Selective Retailing
REST OF EUROPE
391 STORES
■157 Fashion and Leather Goods
■3 Perfumes and Cosmetics
■8 Watches and Jew elry
■223 Selective Retailing
JAPAN
214 STORES
■195 Fashion and Leather Goods
■3 Perfumes and Cosmetics
■15 Watches and Jewelry
■ 1 Selective Retailing
SOUTH AM ERICA
14 STORES
■14 Fashion and Leather Goods
AFRICA AND M IDDLE EAST
5 STORES
■5 Fashion and Leather Goods
ASIA (EXCLUDING JAPAN)
256 STORES
■164 Fashion and Leather Goods
■6 Perfumes and Cosmetics
■2 Watches and Jew elry
■84 Selective Retailing
PACIFIC REGION
28 STORES
■18 Fashion and Leather Goods
■1 Watches and Jew elry
■9 Selective Retailing
NET SALES
BY GEOGRAPHIC
REGION
Other markets: 6%
Rest of Asia: 15%
United States: 27%
Rest of
Europe:
20%
France:
17%
Japan: 15%
NET SALES
BY CURRENCY
Other currencies:
16 %
Yen: 16%
US Dollar:
32%
Euro:
32%
Dollar
Hong Kong: 4%