Louis Vuitton 2002 Annual Report Download - page 6
Download and view the complete annual report
Please find page 6 of the 2002 Louis Vuitton annual report below. You can navigate through the pages in the report by either clicking on the pages listed below, or by using the keyword search tool below to find specific information within the annual report.-
 1
1 -
 2
2 -
 3
3 -
 4
4 -
 5
5 -
 6
6 -
 7
7 -
 8
8 -
 9
9 -
 10
10 -
 11
11 -
 12
12 -
 13
13 -
 14
14 -
 15
15 -
 16
16 -
 17
17 -
18
-
19
-
20
-
21
-
22
-
23
-
24
-
25
-
26
-
27
-
28
-
29
-
30
-
31
-
32
-
33
-
34
-
35
-
36
-
37
-
38
-
39
-
40
-
41
-
42
-
43
-
44
-
45
-
46
-
47
-
48
-
49
-
50
-
51
-
52
-
53
-
54
-
55
-
56
-
57
-
58
-
59
-
60
-
61
-
62
-
63
-
64
-
65
-
66
-
67
-
68
-
69
-
70
-
71
-
72
-
73
-
74
-
75
-
76
-
77
-
78
-
79
-
80
-
81
-
82
-
83
-
84
-
85
-
86
-
87
-
88
-
89
-
90
-
91
-
92
-
93
-
94
-
95
-
96
-
97
-
98
-
99
-
100
-
101
-
102
-
103
-
104
-
105
-
106
-
107
-
108
 |
 |

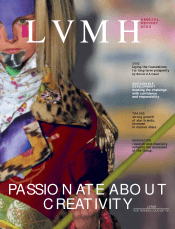
04 •05 ANNUAL REPORT 2002
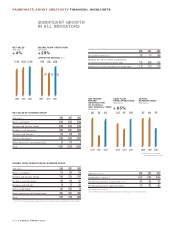
PASSIONATE ABOUT CREATIVITY FINANCIAL HIGHLIGHTS
SIGNIFICANT GROWTH
IN ALL INDICATORS
NET SALES BY BUSINESS GROUP
(EUR million)
2000 2001 2002
Wines and Spirits
2,336 2,232 2,266
Fashion and Leather Goods
3,202 3,612 4,194
Pe rfumes and Cosmetics
2,072 2,231 2,336
Watches and Jewelry
614 548 552
Selective Retailing*
3,294 3,493 3,337
Other businesses and eliminations
63 113 8
Total
11,581 12,229 12,693
INCOM E FROM OPERATIONS BY BUSINESS GROUP
(EUR million)
2000 2001 2002
Wines and Spirits
716 676 750
Fashion and Leather Goods
1,169 1,274 1,297
Pe rfumes and Cosmetics
184 149 161
Watches and Jewelry
59 27 (13)
Selective Retailing*
(65) (213) 20
Other businesses and eliminations
(104) (353) (207)
Total
1,959 1,560 2,008
*2000 and 2001 figures have been restated to take into account cert ain reclassifications made in 2002.
2000 2001 2002
Net income (EUR million)
722 10 556
Earnings per share before amortization
of goodw ill and unusual items (EUR)
1.75 0.68 1.67
Dividend per share including tax credit (EUR)
1.13 1.13 1.20
(EUR million and %)
2000 2001 2002
Stockholders’ equity (2)
8,512 8,701 8,842
Net financial debt to equity ratio (in %)
87% 95% 73%
Net financial debt to adjusted equity*
71% 79% 66%
(2) Includes minorit y int erests.
* Net of LVMH shares not allocated to option plans and Bouygues shares at market value.
NET SALES
(EUR million)
+ 4%
2000 2001 2002
11,581 12,229 12,693
INCOM E FROM OPERATIONS
(EUR million)
+ 29%
OPERATING M ARGIN (In %)
2000 2001 2002
1,959 1,560 2,008
NET INCOM E
BEFORE
AM ORTIZATION
OF GOODWILL
AND UNUSUAL ITEM S
(EUR million)
2000 2001 2002
846 334 818
CASH FLOW
FROM OPERATIONS
(EUR million)
+ 65%
2000 2001 2002
1,214 919 1,518
CAPITAL
EXPENDITURES(1)
(EUR million)
2000 2001 2002
857 984 559
(1) Acquisit ions of intangible
and tangible long-term assets.
17% 13% 16%