Kodak 2011 Annual Report Download - page 30
Download and view the complete annual report
Please find page 30 of the 2011 Kodak annual report below. You can navigate through the pages in the report by either clicking on the pages listed below, or by using the keyword search tool below to find specific information within the annual report.-
 1
1 -
2
-
3
-
4
-
5
-
6
-
7
-
8
-
9
-
10
-
11
-
12
-
13
-
14
-
15
-
16
-
17
-
18
-
19
-
 20
20 -
 21
21 -
 22
22 -
 23
23 -
 24
24 -
 25
25 -
 26
26 -
 27
27 -
 28
28 -
 29
29 -
 30
30 -
 31
31 -
 32
32 -
 33
33 -
 34
34 -
 35
35 -
 36
36 -
 37
37 -
 38
38 -
 39
39 -
 40
40 -
41
-
42
-
43
-
44
-
45
-
46
-
47
-
48
-
49
-
50
-
51
-
52
-
53
-
54
-
55
-
56
-
57
-
58
-
59
-
60
-
61
-
62
-
63
-
64
-
65
-
66
-
67
-
68
-
69
-
70
-
71
-
72
-
73
-
74
-
75
-
76
-
77
-
78
-
79
-
80
-
81
-
82
-
83
-
84
-
85
-
86
-
87
-
88
-
89
-
90
-
91
-
92
-
93
-
94
-
95
-
96
-
97
-
98
-
99
-
100
-
101
-
102
-
103
-
104
-
105
-
106
-
107
-
108
-
109
-
110
-
111
-
112
-
113
-
114
-
115
-
116
-
117
-
118
-
119
-
120
-
121
-
122
-
123
-
124
-
125
-
126
-
127
-
128
-
129
-
130
-
131
-
132
-
133
-
134
-
135
-
136
-
137
-
138
-
139
-
140
-
141
-
142
-
143
-
144
-
145
-
146
-
147
-
148
-
149
-
150
-
151
-
152
-
153
-
154
-
155
-
156
-
157
-
158
-
159
-
160
-
161
-
162
-
163
-
164
-
165
-
166
-
167
-
168
-
169
-
170
-
171
-
172
-
173
-
174
-
175
-
176
-
177
-
178
-
179
-
180
-
181
-
182
-
183
-
184
-
185
-
186
-
187
-
188
-
189
-
190
-
191
-
192
-
193
-
194
-
195
-
196
-
197
-
198
-
199
-
200
-
201
-
202
-
203
-
204
-
205
-
206
-
207
-
208
-
209
-
210
-
211
-
212
-
213
-
214
-
215
-
216
-
217
-
218
-
219
-
220
-
221
-
222
-
223
-
224
-
225
-
226
-
227
-
228
-
229
-
230
-
231
-
232
-
233
-
234
-
235
-
236
-
237
-
238
-
239
-
240
-
241
-
242
-
243
-
244
-
245
-
246
-
247
-
248
-
249
-
250
-
251
-
252
-
253
-
254
-
255
-
256
-
257
-
258
-
259
-
260
-
261
-
262
-
263
-
264
-
265
-
266
-
267
-
268
-
269
-
270
-
271
-
272
-
273
-
274
-
275
-
276
-
277
-
278
-
279
-
280
-
281
-
282
-
283
-
284
-
285
-
286
-
287
-
288
-
289
-
290
-
291
-
292
-
293
-
294
-
295
-
296
-
297
-
298
-
299
-
300
-
301
-
302
-
303
-
304
-
305
-
306
-
307
-
308
-
309
-
310
-
311
-
312
-
313
-
314
-
315
-
316
-
317
-
318
-
319
-
320
-
321
-
322
-
323
-
324
-
325
-
326
-
327
-
328
-
329
-
330
-
331
-
332
-
333
-
334
-
335
-
336
-
337
-
338
-
339
-
340
-
341
-
342
-
343
-
344
-
345
-
346
-
347
-
348
-
349
-
350
-
351
-
352
-
353
-
354
-
355
-
356
-
357
-
358
-
359
-
360
-
361
-
362
-
363
-
364
-
365
-
366
-
367
-
368
-
369
-
370
-
371
-
372
-
373
-
374
-
375
-
376
-
377
-
378
-
379
-
380
-
381
-
382
-
383
-
384
-
385
-
386
-
387
-
388
-
389
-
390
-
391
-
392
-
393
-
394
-
395
-
396
-
397
-
398
-
399
-
400
-
401
-
402
-
403
-
404
-
405
-
406
-
407
-
408
-
409
-
410
-
411
-
412
-
413
-
414
-
415
-
416
-
417
-
418
-
419
-
420
-
421
-
422
-
423
-
424
-
425
-
426
-
427
-
428
-
429
-
430
-
431
-
432
-
433
-
434
-
435
-
436
-
437
-
438
-
439
-
440
-
441
-
442
-
443
-
444
-
445
-
446
-
447
-
448
-
449
-
450
-
451
-
452
-
453
-
454
-
455
-
456
-
457
-
458
-
459
-
460
-
461
-
462
-
463
-
464
-
465
-
466
-
467
-
468
-
469
-
470
-
471
-
472
-
473
-
474
-
475
-
476
-
477
-
478
-
479
-
480
-
481
-
482
-
483
-
484
-
485
-
486
-
487
-
488
-
489
-
490
-
491
-
492
-
493
-
494
-
495
-
496
-
497
-
498
-
499
-
500
-
501
-
502
-
503
-
504
-
505
-
506
-
507
-
508
-
509
-
510
-
511
-
512
-
513
-
514
-
515
-
516
-
517
-
518
-
519
-
520
-
521
-
522
-
523
-
524
-
525
-
526
-
527
-
528
-
529
-
530
-
531
-
532
-
533
-
534
-
535
-
536
-
537
-
538
-
539
-
540
-
541
-
542
-
543
-
544
-
545
-
546
-
547
-
548
-
549
-
550
-
551
-
552
-
553
-
554
-
555
-
556
-
557
-
558
-
559
-
560
-
561
-
562
-
563
-
564
-
565
-
566
-
567
-
568
-
569
-
570
-
571
-
572
-
573
-
574
-
575
-
576
-
577
-
578
-
579
-
580
-
581
 |
 |

Pension and Other Postretirement Benefits
The Company’s defined benefit pension and other postretirement benefit costs and obligations are estimated using several key assumptions. These
assumptions, which are reviewed at least annually by the Company, include the discount rate, long-term expected rate of return on plan assets
(“EROA”), salary growth, healthcare cost trend rate and other economic and demographic factors. Actual results that differ from the Company’s
assumptions are recorded as unrecognized gains and losses and are amortized to earnings over the estimated future service period of the active
participants in the plan or, if almost all of a plan’s participants are inactive, the average remaining lifetime expectancy of inactive participants, to the
extent such total net unrecognized gains and losses exceed 10% of the greater of the plan's projected benefit obligation or the calculated value of plan
assets. Significant differences in actual experience or significant changes in future assumptions would affect the Company’s pension and other
postretirement benefit costs and obligations.
The EROA assumption is based on a combination of formal asset and liability studies that include forward-looking return expectations, given the
current asset allocation. The EROA, once set, is applied to the calculated value of plan assets in the determination of the expected return component of
the Company’s pension income or expense. The Company uses a calculated value of plan assets, which recognizes changes in the fair value of assets
over a four-year period, to calculate expected return on assets. At December 31, 2011, the calculated value of the assets of the Company’s major U.S.
and Non-U.S. defined benefit pension plans was approximately $7.3 billion and the fair value was approximately $7.2 billion. Asset gains and losses
that are not yet reflected in the calculated value of plan assets are not included in amortization of unrecognized gains and losses.
The Company reviews its EROA assumption annually. To facilitate this review, every three years, or when market conditions change materially, the
Company’s larger plans will undertake asset allocation or asset and liability modeling studies. The weighted average EROA for major U.S. and non-
U.S. defined benefit pension plans used to determine net pension expense was 8.09% and 7.79%, respectively, for the year ended December 31, 2011.
Generally, the Company bases the discount rate assumption for its significant plans on high quality corporate bond yields in the respective countries as
of the measurement date. Specifically, for its U.S. and Canadian plans, the Company determines a discount rate using a cash flow model to incorporate
the expected timing of benefit payments and an AA-rated corporate bond yield curve. For the Company's U.S. plans, the Citigroup Above Median
Pension Discount Curve is used. For the Company’s other non-U.S. plans, the discount rates are determined by comparison to published local high
quality bond yields or indices considering estimated plan duration and removing any outlying bonds, as warranted.
The salary growth assumptions are determined based on the Company’s long-term actual experience and future and near-term outlook. The healthcare
cost trend rate assumptions are based on historical cost and payment data, the near-term outlook and an assessment of the likely long-term trends.
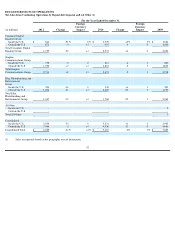
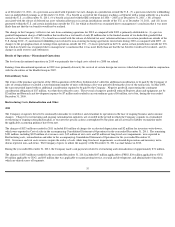
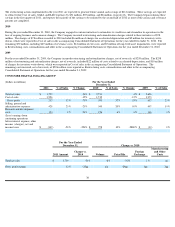
The following table illustrates the sensitivity to a change to certain key assumptions used in the calculation of expense for the year ending December
31, 2012 and the projected benefit obligation (“PBO”) at December 31, 2011 for the Company's major U.S. and non-U.S. defined benefit pension
plans:
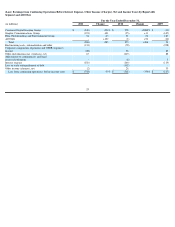
Total pension cost from continuing operations before special termination benefits, curtailments, and settlements for the major funded and unfunded
defined benefit pension plans in the U.S. is expected to change from income of $61 million in 2011 to expense of approximately $45 million in 2012,
due primarily to an expected increase in amortization of actuarial losses. Pension expense from continuing operations
(in millions)
Impact on 2012
Pre-Tax Pension Expense
Increase (Decrease)
Impact on PBO
December 31, 2011 Increase
(Decrease)
U.S.
Non
-
U.S.
U.S.
Non
-
U.S.
Change in assumption:
25 basis point decrease in discount rate
$
6
$
3
$
128
$
125
25 basis point increase in discount rate
(6
)
(3
)
(122
)
(119
)
25 basis point decrease in EROA
11
6
N/A
N/A
25 basis point increase in EROA
(11
)
6
N/A
N/A
29