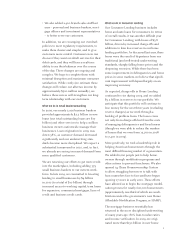
JP Morgan Chase 2009 Annual Report Download - page 9
Download and view the complete annual report
Please find page 9 of the 2009 JP Morgan Chase annual report below. You can navigate through the pages in the report by either clicking on the pages listed below, or by using the keyword search tool below to find specific information within the annual report.
7
billion in securities – to us this is akin to the
inventory of a store. We hold the securities
so we can meet client demand. Our sales and
trading functions not only play a critical role
in helping to maintain large, liquid and well-
functioning markets, but they are indispens-
able to institutions of all types seeking to raise
capital in the first place.
As more clients chose to work with us in 2009,
our sales and trading teams gained market
share. We estimate that our market share
of the top 10 players in Fixed Income and
Equity Markets combined grew from approxi-
mately 9% in 2008 to more than 12% in 2009.
Deservedly, these groups also received a lot
of accolades – most gratifyingly, from client-
based surveys.
How we intend to grow
In 2010, we will continue to focus on the
fundamentals of investment banking: advising
companies and investors, raising capital,
making markets and executing for our clients
worldwide. If we do this well, we are helping
not only our clients but the global economic
recovery as well.
We also are aggressively and organically
growing many parts of our business. For
example, the Prime Services business we
acquired from Bear Stearns – which provides
mostly large investors with custody, financing
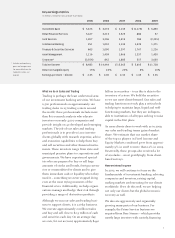
Key earnings metrics
(in millions, except for ratio and per share data)
What we do in Sales and Trading
Trading is perhaps the least understood area
of our investment banking activities. We have
6,500 professionals on approximately 120
trading desks in 25 trading centers around
the world; these professionals include more
than 800 research analysts who educate
investors on nearly 4,000 companies and
provide insight on 40 developed and emerging
markets. The job of our sales and trading
professionals is to provide 16,000 investor
clients globally with research expertise, advice
and execution capabilities to help them buy
and sell securities and other financial instru-
ments. These investors range from state and
municipal pension plans to corporations and
governments. We have experienced special-
ists who are prepared to buy or sell large
amounts of stocks and bonds, foreign curren-
cies or commodities for clients and to give
them immediate cash or liquidity when they
need it – something we never stopped doing
even at the most trying moments of the
financial crisis. Additionally, we help organi-
zations manage and hedge their risk through
providing a range of derivatives products.
Although we run our sales and trading busi-
ness to support clients, it is a risky business.
We execute approximately 2 million trades
and buy and sell close to $2.5 trillion of cash
and securities each day. On an average day,
we own, for our account, approximately $440
2005 2006 2007 2008 2009
Investment Bank $ 3,673 $ 3,674 $ 3,139 $ (1,175 ) $ 6,899
Retail Financial Services 3,427 3,213 2,925 880 97
Card Services 1,907 3,206 2,919 780 (2,225 )
Commercial Banking 951 1,010 1,134 1,439 1,271
Treasury & Securities Services 863 1,090 1,397 1,767 1,226
Asset Management 1,216 1,409 1,966 1,357 1,430
Corporate* (3,554 ) 842 1,885 557 3,030
Total net income $ 8,483 $ 14,444 $ 15,365 $ 5,605 $ 11,728
Return on tangible equity 15 % 24 % 22 % 6 % 10 %
Earnings per share — diluted $ 2.35 $ 4.00 $ 4.33 $ 1.35 $ 2.26
* Includes extraordinary
gains and merger costs.
For more details on the
Corporate sector, see
page 82.


