JP Morgan Chase 2009 Annual Report Download - page 7
Download and view the complete annual report
Please find page 7 of the 2009 JP Morgan Chase annual report below. You can navigate through the pages in the report by either clicking on the pages listed below, or by using the keyword search tool below to find specific information within the annual report.-
 1
1 -
 2
2 -
 3
3 -
 4
4 -
 5
5 -
 6
6 -
 7
7 -
 8
8 -
 9
9 -
 10
10 -
 11
11 -
 12
12 -
 13
13 -
 14
14 -
 15
15 -
 16
16 -
 17
17 -
 18
18 -
19
-
20
-
21
-
22
-
23
-
24
-
25
-
26
-
27
-
28
-
29
-
30
-
31
-
32
-
33
-
34
-
35
-
36
-
37
-
38
-
39
-
40
-
41
-
42
-
43
-
44
-
45
-
46
-
47
-
48
-
49
-
50
-
51
-
52
-
53
-
54
-
55
-
56
-
57
-
58
-
59
-
60
-
61
-
62
-
63
-
64
-
65
-
66
-
67
-
68
-
69
-
70
-
71
-
72
-
73
-
74
-
75
-
76
-
77
-
78
-
79
-
80
-
81
-
82
-
83
-
84
-
85
-
86
-
87
-
88
-
89
-
90
-
91
-
92
-
93
-
94
-
95
-
96
-
97
-
98
-
99
-
100
-
101
-
102
-
103
-
104
-
105
-
106
-
107
-
108
-
109
-
110
-
111
-
112
-
113
-
114
-
115
-
116
-
117
-
118
-
119
-
120
-
121
-
122
-
123
-
124
-
125
-
126
-
127
-
128
-
129
-
130
-
131
-
132
-
133
-
134
-
135
-
136
-
137
-
138
-
139
-
140
-
141
-
142
-
143
-
144
-
145
-
146
-
147
-
148
-
149
-
150
-
151
-
152
-
153
-
154
-
155
-
156
-
157
-
158
-
159
-
160
-
161
-
162
-
163
-
164
-
165
-
166
-
167
-
168
-
169
-
170
-
171
-
172
-
173
-
174
-
175
-
176
-
177
-
178
-
179
-
180
-
181
-
182
-
183
-
184
-
185
-
186
-
187
-
188
-
189
-
190
-
191
-
192
-
193
-
194
-
195
-
196
-
197
-
198
-
199
-
200
-
201
-
202
-
203
-
204
-
205
-
206
-
207
-
208
-
209
-
210
-
211
-
212
-
213
-
214
-
215
-
216
-
217
-
218
-
219
-
220
-
221
-
222
-
223
-
224
-
225
-
226
-
227
-
228
-
229
-
230
-
231
-
232
-
233
-
234
-
235
-
236
-
237
-
238
-
239
-
240
-
241
-
242
-
243
-
244
-
245
-
246
-
247
-
248
-
249
-
250
-
251
-
252
-
253
-
254
-
255
-
256
-
257
-
258
-
259
-
260
 |
 |

the cost of this improved level of operation
and service per dollar of revenue is signifi-
cantly lower than in the past. To give just
one example, our total technology and opera-
tions and corporate overhead costs would be
more than $9 billion higher today if they were
running at the same cost per dollar of revenue
as in 2005.
Continuing to invest
Through the worst of the past two years, we
never stopped investing. This has included
acquisitions, foremost among them Bear
Stearns and Washington Mutual; investments
in infrastructure, including systems and tech-
nology; new products, for example in Card
Services; and the addition of bankers and
branches around the world. These investments
set us up for continued organic growth.
Preparing for tougher global competition
The competitive landscape is rapidly changing.
Many companies did not make it or had to
be dramatically restructured. We expect this
trend to continue in both the United States
and Europe. We and others who survived
benefited from market share gains (in fact,
we gained market share in virtually all of our
businesses). But we must be prepared for all
of our competitors to come roaring back. With
certain competitors and in certain parts of the
world, this already is happening. We do not
take this lightly.
Protecting the company in uncertain times
You read about it every day: continued global
trade imbalances, higher fiscal deficits run
by governments around the world, uncertain
interest rate movements and potential regula-
tory changes, among other issues. I could go on
for pages. Rest assured, we are paying very close
attention to the dicult issues we still face.
Following is a recap of our line of business
results. In this section, I will focus on
describing what we as a bank actually do,
which seems to be so often misunderstood.
As you read these results, I hope you will feel
as I do – that we have excellent franchises,
focused on doing a great job for our customers
(even though we do make mistakes), and that
we have been continuously and deliberately
investing for future growth.
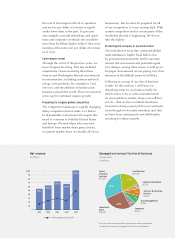
Net revenue
(in billions)
30
40
50
60
70
80
90
$100
20
10
20092005 2007
2006
$54.2
$71.4
2008
$67.3
$62.0
$100.4
Pretax preprovision profit
Managed net revenue* by line of business
Full year 2009
(in millions)
Investment
Bank
$28,109
Retail
Financial
Services
$32,692
Card Services
$20,304
Commercial Banking
$5,720
Treasury & Securities
Services
$7,344
Asset Management
$7,965
Corporate
$6,513
26%
30%
19%
5%
7%
7%
6% Asset Managemen
* For a discussion of managed basis presentation and a reconciliation
to reported net revenue, see pages 58-59 of this Annual Report.