JP Morgan Chase 2009 Annual Report Download - page 21
Download and view the complete annual report
Please find page 21 of the 2009 JP Morgan Chase annual report below. You can navigate through the pages in the report by either clicking on the pages listed below, or by using the keyword search tool below to find specific information within the annual report.-
 1
1 -
2
-
3
-
4
-
5
-
6
-
7
-
8
-
9
-
10
-
 11
11 -
 12
12 -
 13
13 -
 14
14 -
 15
15 -
 16
16 -
 17
17 -
 18
18 -
 19
19 -
 20
20 -
 21
21 -
 22
22 -
 23
23 -
 24
24 -
 25
25 -
 26
26 -
 27
27 -
 28
28 -
 29
29 -
 30
30 -
 31
31 -
32
-
33
-
34
-
35
-
36
-
37
-
38
-
39
-
40
-
41
-
42
-
43
-
44
-
45
-
46
-
47
-
48
-
49
-
50
-
51
-
52
-
53
-
54
-
55
-
56
-
57
-
58
-
59
-
60
-
61
-
62
-
63
-
64
-
65
-
66
-
67
-
68
-
69
-
70
-
71
-
72
-
73
-
74
-
75
-
76
-
77
-
78
-
79
-
80
-
81
-
82
-
83
-
84
-
85
-
86
-
87
-
88
-
89
-
90
-
91
-
92
-
93
-
94
-
95
-
96
-
97
-
98
-
99
-
100
-
101
-
102
-
103
-
104
-
105
-
106
-
107
-
108
-
109
-
110
-
111
-
112
-
113
-
114
-
115
-
116
-
117
-
118
-
119
-
120
-
121
-
122
-
123
-
124
-
125
-
126
-
127
-
128
-
129
-
130
-
131
-
132
-
133
-
134
-
135
-
136
-
137
-
138
-
139
-
140
-
141
-
142
-
143
-
144
-
145
-
146
-
147
-
148
-
149
-
150
-
151
-
152
-
153
-
154
-
155
-
156
-
157
-
158
-
159
-
160
-
161
-
162
-
163
-
164
-
165
-
166
-
167
-
168
-
169
-
170
-
171
-
172
-
173
-
174
-
175
-
176
-
177
-
178
-
179
-
180
-
181
-
182
-
183
-
184
-
185
-
186
-
187
-
188
-
189
-
190
-
191
-
192
-
193
-
194
-
195
-
196
-
197
-
198
-
199
-
200
-
201
-
202
-
203
-
204
-
205
-
206
-
207
-
208
-
209
-
210
-
211
-
212
-
213
-
214
-
215
-
216
-
217
-
218
-
219
-
220
-
221
-
222
-
223
-
224
-
225
-
226
-
227
-
228
-
229
-
230
-
231
-
232
-
233
-
234
-
235
-
236
-
237
-
238
-
239
-
240
-
241
-
242
-
243
-
244
-
245
-
246
-
247
-
248
-
249
-
250
-
251
-
252
-
253
-
254
-
255
-
256
-
257
-
258
-
259
-
260
 |
 |

all. We are unable to fi nd real comparisons.
Much of the anger about highly compensated
individuals at banks relates to the argument
that all of these companies would have failed,
which we do not believe is true (more detail
on this in the next section). Finally, the more
highly paid the individual is at JPMorgan
Chase, the higher the percentage of compensa-
tion awarded in restricted stock and options.
Before we speak specifi cally about how we
compensate individuals at JPMorgan Chase,
it’s appropriate to outline our principles.
Some key compensation principles at
JPMorgan Chase
We believe the compensation principles we
use are best practices and compare favorably
with those outlined by outside authorities,
such as the G-20, the Financial Services
Authority, the Financial Stability Board, the
Federal Reserve and the U.S. Treasury. Our
principles are as follows:
• Pay a signifi cant percentage of our incentive
compensation in stock: at least 67% for the
Operating Committee members and approxi-
mately 50% for the remainder of our senior
management team.
• Structure the stock we grant – restricted stock
units or options – to vest over multiple years.
• Require Operating Committee members to
retain and hold approximately 75% of the
stock they receive from the company after
the stock vests.
• Generally do not provide multi-year guar-
antees to new hires and almost never to
current employees.
• Institute meaningful recoupment policies,
some of which we enhanced in 2008 and
2009 and are progressively more strin-
gent at higher levels of management. For
all employees, if anyone causes material
fi nancial or reputational harm to the fi rm
or its business activities, we can recoup the
employee’s incentives, including stock.
• For approximately 500 senior individuals,
unvested stock also can be recouped for
failure to properly identify, raise or assess, in
a timely manner and as reasonably expected,
material risks to the fi rm.
• For the Operating Committee and for me,
unvested stock or options can be recouped
not only for the reasons mentioned above but
also if reasonable progress toward personal
and company goals is not met. This is at the
discretion of the Board of Directors.
1 Compensation/revenue based on
U.S. data only; JPMorgan Chase
data based on worldwide totals.
2 Net income margin based on
2004–2008 average for S&P 500
companies and adjusted for
exceptional losses/gains.
3 Compensation/sales based on
U.S. Census Bureau data.
4 Revenue based on 2009 gross
revenue before interest expense.
5 Includes investment banks,
asset management fi rms, capital
markets fi rms and other non-
lending fi nancial institutions.
6 Includes regional banks, credit
card companies and other credit/
lending institutions.
NA — Not applicable.
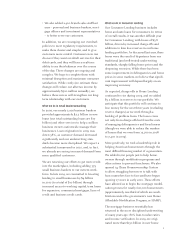
10% 20% 30% 40%
Healthcare providers and services
Professional, scientific and technical services
Newspapers
J.P. Morgan Investment Bank (gross revenue)
Transportation and warehousing
Securities and other finance
Fast food
JPMorgan Chase (gross revenue)
Construction
Nationwide — average
Telecommunications
Traditional finance
Manufacturing
Retail
5.9%
4.7%
0.2%
NA
2.3%
2.2%
0.6%
NA
6.2%
NA
1.7%
4.6%
18.5%
13.6%
10.5 X
4.6 X
2.8 X
1.4 X
3.6 X
2.4 X
2.3 X
2.3 X
3.6 X
NA
2.0 X
1.0 X
1.3 X
2.4 X
4
5
4
6
Industry Compensation/revenue 1% of
U.S. sales 3
Compensation/
net income 2
JPMorgan Chase 2009
reported compensation/
revenue ratio is 27%, which
refl ects revenue net of interest
expense, unlike other industries.
Compensation ratios by industry
The industry compensation ratios in the table above refl ect 2007 information contained in U.S. Census Bureau data, Capital IQ Compustat
records and company fi lings and are based on revenue before deducting interest expense, whereas JPMorgan Chase and other fi nancial
services fi rms report their compensation ratios based on revenue net of interest expense.
19