JP Morgan Chase 2009 Annual Report Download - page 17
Download and view the complete annual report
Please find page 17 of the 2009 JP Morgan Chase annual report below. You can navigate through the pages in the report by either clicking on the pages listed below, or by using the keyword search tool below to find specific information within the annual report.-
 1
1 -
2
-
3
-
4
-
5
-
6
-
 7
7 -
 8
8 -
 9
9 -
 10
10 -
 11
11 -
 12
12 -
 13
13 -
 14
14 -
 15
15 -
 16
16 -
 17
17 -
 18
18 -
 19
19 -
 20
20 -
 21
21 -
 22
22 -
 23
23 -
 24
24 -
 25
25 -
 26
26 -
 27
27 -
28
-
29
-
30
-
31
-
32
-
33
-
34
-
35
-
36
-
37
-
38
-
39
-
40
-
41
-
42
-
43
-
44
-
45
-
46
-
47
-
48
-
49
-
50
-
51
-
52
-
53
-
54
-
55
-
56
-
57
-
58
-
59
-
60
-
61
-
62
-
63
-
64
-
65
-
66
-
67
-
68
-
69
-
70
-
71
-
72
-
73
-
74
-
75
-
76
-
77
-
78
-
79
-
80
-
81
-
82
-
83
-
84
-
85
-
86
-
87
-
88
-
89
-
90
-
91
-
92
-
93
-
94
-
95
-
96
-
97
-
98
-
99
-
100
-
101
-
102
-
103
-
104
-
105
-
106
-
107
-
108
-
109
-
110
-
111
-
112
-
113
-
114
-
115
-
116
-
117
-
118
-
119
-
120
-
121
-
122
-
123
-
124
-
125
-
126
-
127
-
128
-
129
-
130
-
131
-
132
-
133
-
134
-
135
-
136
-
137
-
138
-
139
-
140
-
141
-
142
-
143
-
144
-
145
-
146
-
147
-
148
-
149
-
150
-
151
-
152
-
153
-
154
-
155
-
156
-
157
-
158
-
159
-
160
-
161
-
162
-
163
-
164
-
165
-
166
-
167
-
168
-
169
-
170
-
171
-
172
-
173
-
174
-
175
-
176
-
177
-
178
-
179
-
180
-
181
-
182
-
183
-
184
-
185
-
186
-
187
-
188
-
189
-
190
-
191
-
192
-
193
-
194
-
195
-
196
-
197
-
198
-
199
-
200
-
201
-
202
-
203
-
204
-
205
-
206
-
207
-
208
-
209
-
210
-
211
-
212
-
213
-
214
-
215
-
216
-
217
-
218
-
219
-
220
-
221
-
222
-
223
-
224
-
225
-
226
-
227
-
228
-
229
-
230
-
231
-
232
-
233
-
234
-
235
-
236
-
237
-
238
-
239
-
240
-
241
-
242
-
243
-
244
-
245
-
246
-
247
-
248
-
249
-
250
-
251
-
252
-
253
-
254
-
255
-
256
-
257
-
258
-
259
-
260
 |
 |
15
In 2010, we plan to expand Private Banking
globally by adding more than 500 bankers,
investors and client service employees. In addi-
tion, we intend to continue to invest in the
growth of the brokerage business we acquired
from Bear Stearns. We anticipate a slowly
improving but volatile investment environ-
ment in 2010 – yet, nonetheless, we expect
Asset Management to continue to thrive by
helping millions of individuals, families and
institutions achieve their financial goals.
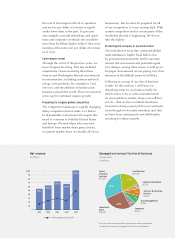
The Corporate sector reported net income
of $3.7 billion
Our Corporate sector, excluding merger-
related items, produced net income of $3.7
billion compared with $768 million in the
prior year. The Corporate sector comprises
three segments: Private Equity, unallocated
corporate expenses and our corporate invest-
ment portfolio. Our Private Equity segment
reported a net loss of $78 million vs. a net loss
of $690 million in 2008. Remember, however,
in 2007, we had an outstanding year with
pretax Private Equity gains of more than $4
billion. We know that Private Equity returns,
by their nature, are lumpy, but we expect to
average 20% returns over the years.
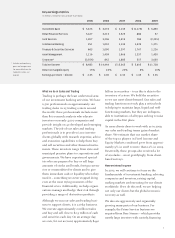
Our corporate investment portfolio, which
we own in order to manage excess cash, our
collateral needs and interest rate exposure,
grew from a low of $91 billion in March 2008
to an average of $324 billion in 2009. Our
investment portfolio produced exceptional
performance, the result of both managing
interest rate exposures and buying securities
that we thought were extremely safe invest-
ments and were trading at large discounts to
fair value (e.g., mortgage ABS, Triple-A credit
card ABS and Triple-A CLOs). The pretax
unrealized gain of this portfolio went from a
loss of $3.4 billion at the beginning of 2009 to
a gain of $3.3 billion at year-end. It’s impor-
tant to note that your company manages its
interest rate exposure extremely carefully and
believes that taking this exposure is funda-
mentally not how we make our money. Any
investor can take on interest rate exposure –
we do not consider that a business. We do not
borrow “cheap” from the Federal Reserve or
any other source; we borrow at market rates,
like everyone else does.
We may realize some of these Corporate
investment gains in 2010, but we do not expect
these exceptional results to continue. Over
the course of the year, Corporate quarterly
net income (excluding Private Equity, merger-
related items and any significant nonrecurring
items) is expected to decline to approximately
$300 million.