Hyundai 2000 Annual Report Download - page 69
Download and view the complete annual report
Please find page 69 of the 2000 Hyundai annual report below. You can navigate through the pages in the report by either clicking on the pages listed below, or by using the keyword search tool below to find specific information within the annual report.-
 1
1 -
2
-
3
-
4
-
5
-
6
-
7
-
8
-
9
-
10
-
11
-
12
-
13
-
14
-
15
-
16
-
17
-
18
-
19
-
20
-
21
-
22
-
23
-
24
-
25
-
26
-
27
-
28
-
29
-
30
-
31
-
32
-
33
-
34
-
35
-
36
-
37
-
38
-
39
-
40
-
41
-
42
-
43
-
44
-
45
-
46
-
47
-
48
-
49
-
50
-
51
-
52
-
53
-
54
-
55
-
56
-
57
-
58
-
 59
59 -
 60
60 -
 61
61 -
 62
62 -
 63
63 -
 64
64 -
 65
65 -
 66
66 -
 67
67 -
 68
68 -
 69
69 -
 70
70 -
 71
71 -
 72
72 -
 73
73 -
 74
74
 |
 |

67
2000 Annual Report •Hyundai-Motor Company
NOTES TO FINANCIAL STATEMENTS
December 31, 2000 and 1999
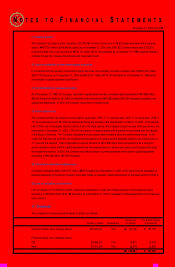
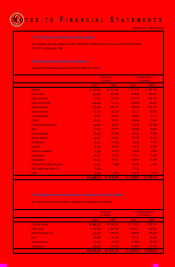
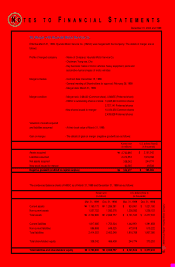
26. Merger with Hyundai Motor Service Co.
Effective March 31, 1999, Hyundai Motor Service Co. (HMSC) was merged with the Company. The details of merger are as
follows:
Profile of merged company - Name of Company: Hyundai Motor Service Co.
- Chairman: Yang-rae, Cho
- Key business: Sales of motor vehicles, heavy equipment, parts and
automotive fuel and repair of motor vehicles
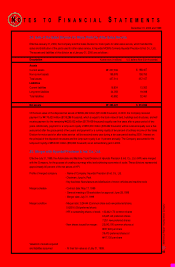
Merger schedule - Contract date: December 15, 1998
- General meeting of Shareholders for approval: February 26, 1999
- Merger date: March 31, 1999
Merger condition - Merger ratio: 0.68420 (Common share), 0.88455 (Preferred share)
- HMSC’s outstanding shares of stock: 14,665,640 Common shares
2,757,141 Preferred shares
-New shares issued for merger: 10,034,230 Common shares
2,438,829 Preferred shares
Valuation of assets acquired
and liabilities assumed - At their book value of March 31, 1999.
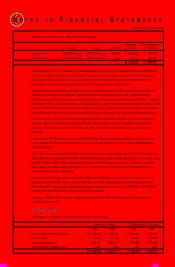
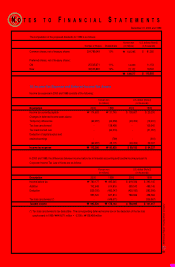
Gain on merger - The details of gain on merger (negative goodwill) are as follows:
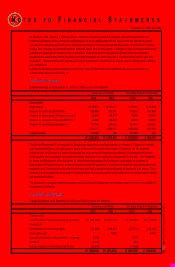
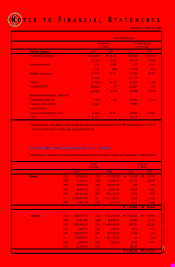
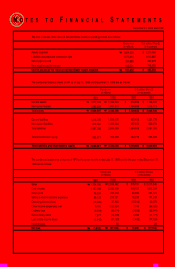
The condensed balance sheets of HMSC as of March 31, 1999 and December 31, 1998 are as follows:
Current assets
Non-current assets
Total assets
Current liabilities
Non-current liabilities
Total liabilities
Total shareholders’ equity
Total liabilities and shareholders’ equity
Mar. 31, 1999
$ 924,961
1,236,582
$ 2,161,543
1,442,951
473,818
1,916,769
244,774
$ 2,161,543
Dec. 31, 1998
$ 1,021,180
1,256,153
$ 2,277,333
1,391,858
515,222
1,907,080
370,253
$ 2,277,333
Dec. 31, 1998
₩1,286,381
1,582,376
₩2,868,757
1,753,324
649,025
2,402,349
466,408
₩
₩2,868,757
Mar. 31, 1999
₩1,165,173
1,557,722
₩2,722,895
1,817,685
596,868
2,414,553
308,342
₩
₩2,722,895
U.S. dollars (Note 2)
(in thousands)
Korean won
(in millions)
Assets acquired
Liabilities assumed
Net assets acquired
New stock issued for merger
Negative goodwill (credited to capital surplus)
$ 2,161,542
1,916,768
244,774
49,508
$ 195,266
₩2,722,895
2,414,553
308,342
62,365
₩
₩245,977
U.S. dollars (Note 2)
(in thousands)
Korean won
(in millions)