Hyundai 2000 Annual Report Download - page 64
Download and view the complete annual report
Please find page 64 of the 2000 Hyundai annual report below. You can navigate through the pages in the report by either clicking on the pages listed below, or by using the keyword search tool below to find specific information within the annual report.-
 1
1 -
2
-
3
-
4
-
5
-
6
-
7
-
8
-
9
-
10
-
11
-
12
-
13
-
14
-
15
-
16
-
17
-
18
-
19
-
20
-
21
-
22
-
23
-
24
-
25
-
26
-
27
-
28
-
29
-
30
-
31
-
32
-
33
-
34
-
35
-
36
-
37
-
38
-
39
-
40
-
41
-
42
-
43
-
44
-
45
-
46
-
47
-
48
-
49
-
50
-
51
-
52
-
53
-
 54
54 -
 55
55 -
 56
56 -
 57
57 -
 58
58 -
 59
59 -
 60
60 -
 61
61 -
 62
62 -
 63
63 -
 64
64 -
 65
65 -
 66
66 -
 67
67 -
 68
68 -
 69
69 -
 70
70 -
 71
71 -
 72
72 -
 73
73 -
 74
74
 |
 |

NOTES TO FINANCIAL STATEMENTS
December 31, 2000 and 1999
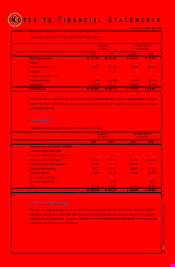
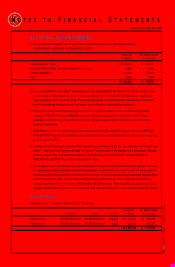
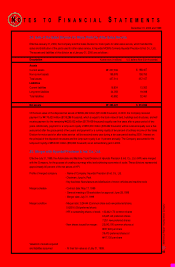
When each temporary difference reverses in the future, it will result in a decrease (increase) of taxable income and income tax
payable. Deferred income tax assets are recognized only when it is probable the tax benefits from temporary differences will
be realized in the future. As of December 31, 2000, the Company believes the deferred income tax assets of ₩240,853 million
($191,198 thousand) can be realized in the future. Additionally, the Company believes average ordinary income in the coming
years will exceed the amount of deferred taxes to be realized every year based on its assessment. Accordingly, the Company
has recognized deferred income tax assets as of December 31, 2000 and 1999 and as a result, its effective tax rate is 14.39
percent in 2000 and 16.34 percent in 1999.
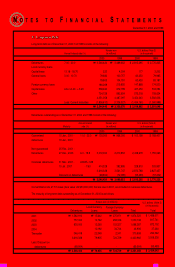
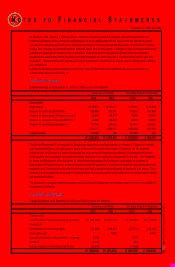
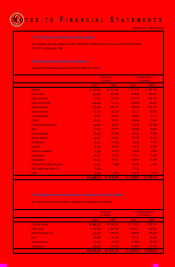
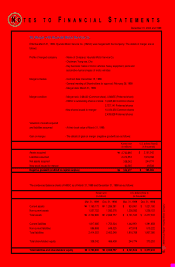
19. Related Party Transactions
Significant transactions with affiliated companies in 2000 and 1999 and outstanding balances as of December 31, 2000 and
1999 are summarised below:
(*) Sales in 2000 include the disposal value of the Motor Parts Division for after-sales service of ₩446,422 million, which
consists of the lump-sum royalty and the book value of the disposed net assets (See Note 24).
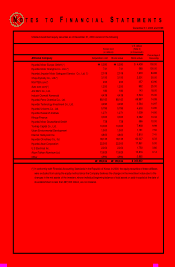
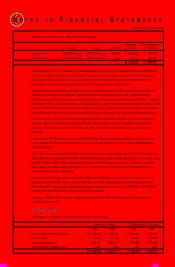
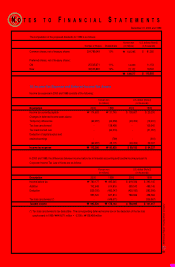
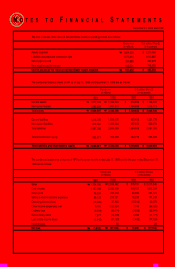
Description
Accumulated temporary
differences, net
Statutory tax rate (%)
Tax credit carried over
Deferred income tax assets
2000
$ 455,008
X 30.8
140,141
51,057
$ 191,198
1999
$ 294,443
X 30.8
90,688
51,057
$ 141,745
1999
₩370,910
X 30.8
114,240
64,316
₩
₩178,556
2000
₩573,174
X 30.8
176,537
64,316
₩
₩240,853
U.S. dollars (Note 2) (in thousands)Korean won (in millions)
Affiliated Company
Hyundai Motor America
Hyundai Motor India
HAOSVT
Kia Motor Corporation
KEFICO
Hyundai MOBIS (*)
(formerly Hyundai Precision Industries Co., Ltd.)
Hyundai HYSCO (formerly Hyundai Pipe Co., Ltd.)
2000
$ 969,743
40,354
213,470
277,033
(73,986)
(291,651)
485,589
(256,519)
(241,846)
1999
$ 1,678,116
86,509
96,065
178,102
(12,556)
(191,313)
93,998
(286,972)
(62,595)
1999
₩2,113,923
108,975
121,013
224,355
(15,817)
(240,997)
118,409
(361,499)
(78,851)
2000
₩2,967,908
86,292
268,908
800,383
(93,200)
(367,393)
611,697
(323,137)
(304,654)
U.S. dollars (Note 2) (in thousands)
Sales (Purchases)
Korean won (in millions)
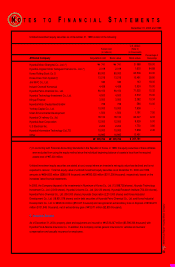
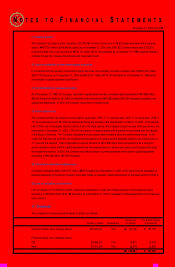
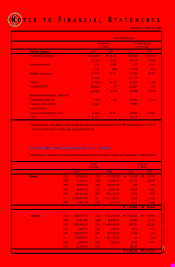
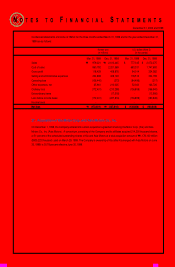
The changes in accumulated temporary differences in 2000 and 1999 are as follows:
The accumulated temporary differences as of December 31, 2000 and 1999 do not include the gain of ₩499,891 million
($396,833 thousand) in 2000 and ₩502,333 million ($398,772 thousand) in 1999 on the revaluation of land which may not be
disposed of in the near future.
Deferred income tax as of December 31, 2000 and 1999 are computed as follows:
Description
Beginning of period, net
Changes in the current year, net
End of period, net
2000
$ 294,443
160,565
$ 455,008
1999
$ 222,861
71,582
$ 294,443
1999
₩280,738
90,172
₩
₩370,910
2000
₩370,910
202,264
₩
₩573,174
U.S. dollars (Note 2) (in thousands)Korean won (in millions)