Hyundai 2000 Annual Report Download - page 68
Download and view the complete annual report
Please find page 68 of the 2000 Hyundai annual report below. You can navigate through the pages in the report by either clicking on the pages listed below, or by using the keyword search tool below to find specific information within the annual report.-
 1
1 -
2
-
3
-
4
-
5
-
6
-
7
-
8
-
9
-
10
-
11
-
12
-
13
-
14
-
15
-
16
-
17
-
18
-
19
-
20
-
21
-
22
-
23
-
24
-
25
-
26
-
27
-
28
-
29
-
30
-
31
-
32
-
33
-
34
-
35
-
36
-
37
-
38
-
39
-
40
-
41
-
42
-
43
-
44
-
45
-
46
-
47
-
48
-
49
-
50
-
51
-
52
-
53
-
54
-
55
-
56
-
57
-
 58
58 -
 59
59 -
 60
60 -
 61
61 -
 62
62 -
 63
63 -
 64
64 -
 65
65 -
 66
66 -
 67
67 -
 68
68 -
 69
69 -
 70
70 -
 71
71 -
 72
72 -
 73
73 -
 74
74
 |
 |

NOTES TO FINANCIAL STATEMENTS
December 31, 2000 and 1999
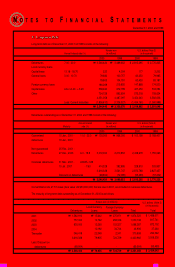
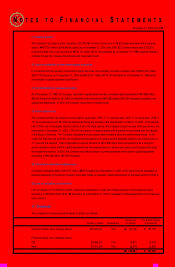
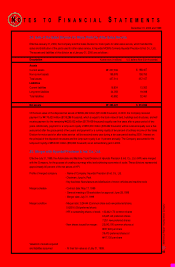
The cost in excess of fair value of net identifiable assets acquired (goodwill) is as follows:
Assets acquired
Liabilities assumed and conversion right
Net equity acquired
New stock issued for merger
Cost in excess of fair value of net identifiable assets acquired
$ 1,273,560
1,010,887
262,673
748,036
$ 485,363
₩1,604,303
1,273,414
330,889
942,301
₩
₩611,412
U.S. dollars (Note 2)
(in thousands)
Korean won
(in millions)
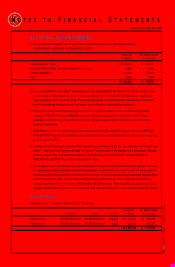
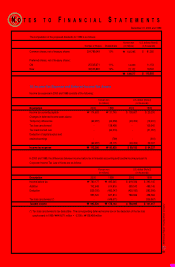
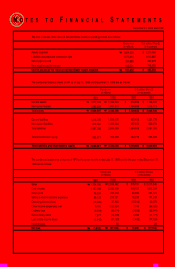
The condensed balance sheets of HPI as of July 31, 1999 and December 31, 1998 are as follows:
Current assets
Non-current assets
Total assets
Current liabilities
Non-current liabilities
Total liabilities
Total shareholders’ equity
Total liabilities and shareholders’ equity
1999
$ 854,996
1,494,688
$ 2,349,684
967,456
697,453
1,664,909
684,775
$ 2,349,684
1998
$ 1,108,633
1,538,313
$ 2,646,946
1,221,779
869,274
2,091,053
555,893
$ 2,646,946
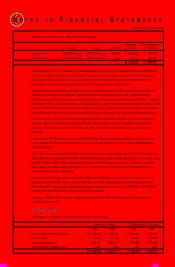
1998
₩1,396,545
1,937,813
₩3,334,358
1,539,075
1,095,024
2,634,099
700,259
₩
₩3,334,358
1999
₩1,077,038
1,882,859
₩2,959,897
1,218,705
878,581
2,097,286
862,611
₩
₩2,959,897
U.S. dollars (Note 2)
(in thousands)
Korean won
(in millions)
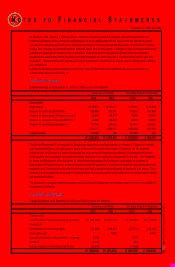
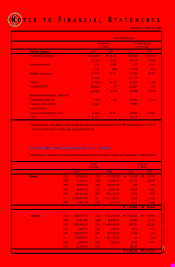
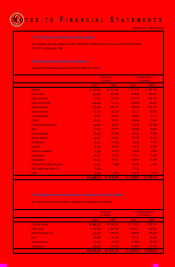
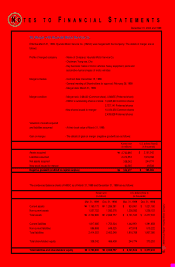
The condensed statements of income of HPI for the seven months ended July 31, 1999 and for the year ended December 31,
1998 are as follows:
Sales
Cost of sales
Gross profit
Selling and administrative expenses
Operating income (loss)
Other income (expenses), net
Ordinary loss
Extraordinary items
Loss before income taxes
Income taxes
Net loss
1999
$ 979,751
918,757
60,994
76,290
(15,296)
7,740
(7,556)
6,094
(1,462)
-
$ (1,462)
1998
$ 2,013,545
1,812,224
201,321
171,248
30,073
(96,020)
(65,947)
(11,177)
(77,124)
29
$ (77,153)
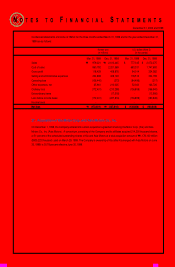
1998
₩2,536,462
2,282,858
253,604
215,721
37,883
(120,957)
(83,074)
(14,079)
(97,153)
36
₩
₩(97,189)
1999
₩1,234,192
1,157,358
76,834
96,103
(19,269)
9,750
(9,519)
7,677
(1,842)
-
₩
₩(1,842)
U.S. dollars (Note 2)
(in thousands)
Korean won
(in millions)