Huntington National Bank 2012 Annual Report Download - page 5
Download and view the complete annual report
Please find page 5 of the 2012 Huntington National Bank annual report below. You can navigate through the pages in the report by either clicking on the pages listed below, or by using the keyword search tool below to find specific information within the annual report.-
 1
1 -
 2
2 -
 3
3 -
 4
4 -
 5
5 -
 6
6 -
 7
7 -
 8
8 -
 9
9 -
 10
10 -
 11
11 -
 12
12 -
 13
13 -
 14
14 -
 15
15 -
 16
16 -
17
-
18
-
19
-
20
-
21
-
22
-
23
-
24
-
25
-
26
-
27
-
28
-
29
-
30
-
31
-
32
-
33
-
34
-
35
-
36
-
37
-
38
-
39
-
40
-
41
-
42
-
43
-
44
-
45
-
46
-
47
-
48
-
49
-
50
-
51
-
52
-
53
-
54
-
55
-
56
-
57
-
58
-
59
-
60
-
61
-
62
-
63
-
64
-
65
-
66
-
67
-
68
-
69
-
70
-
71
-
72
-
73
-
74
-
75
-
76
-
77
-
78
-
79
-
80
-
81
-
82
-
83
-
84
-
85
-
86
-
87
-
88
-
89
-
90
-
91
-
92
-
93
-
94
-
95
-
96
-
97
-
98
-
99
-
100
-
101
-
102
-
103
-
104
-
105
-
106
-
107
-
108
-
109
-
110
-
111
-
112
-
113
-
114
-
115
-
116
-
117
-
118
-
119
-
120
-
121
-
122
-
123
-
124
-
125
-
126
-
127
-
128
-
129
-
130
-
131
-
132
-
133
-
134
-
135
-
136
-
137
-
138
-
139
-
140
-
141
-
142
-
143
-
144
-
145
-
146
-
147
-
148
-
149
-
150
-
151
-
152
-
153
-
154
-
155
-
156
-
157
-
158
-
159
-
160
-
161
-
162
-
163
-
164
-
165
-
166
-
167
-
168
-
169
-
170
-
171
-
172
-
173
-
174
-
175
-
176
-
177
-
178
-
179
-
180
-
181
-
182
-
183
-
184
-
185
-
186
-
187
-
188
-
189
-
190
-
191
-
192
-
193
-
194
-
195
-
196
-
197
-
198
-
199
-
200
-
201
-
202
-
203
-
204
-
205
-
206
-
207
-
208
-
209
-
210
-
211
-
212
 |
 |

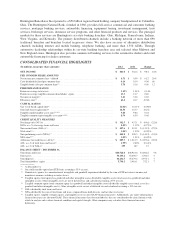
partially by the $1.5 billion, or 19%, decrease in core certificates of deposit. Through our strategic focus on
growing consumer households and commercial relationships by earning their primary checking (demand deposit)
accounts, we continue to improve our overall funding mix.
Noninterest expense increased $107.4 million, or 6%, in 2012. This included a $95.7 million, or 11%,
increase in personnel costs primarily reflecting the addition of 561 full-time equivalent employees, as well as
higher incentive based compensation and a $10.4 million, or 11%, increase in equipment primarily reflecting the
implementation of strategic initiatives, including opening 37, or 6%, net new branches. These increases were
offset partially by a $9.3 million, or 12%, decrease in deposit and other insurance expense. The full year 2012
included $14 million of noninterest expense related to the Fidelity acquisition, which closed on March 30, 2012.
Our efficiency ratio (noninterest expense as a percentage of total revenue) modestly improved to 63.4%, but
remains above our long-term goal of mid 50%’s. The investments we have made and the actions we are taking
provide us with a path to an efficiency ratio below 60%. However, for the Company to reach its long-term goal,
we will need to experience a more normal interest rate environment.
Since turning the corner on credit in 2011, our provision for credit losses has been at the low end of our
long-term expectations. In 2012, the provision for credit losses decreased another $26.7 million, or 15%, to
$147.4 million reflecting a $94.6 million, or 22%, decrease in net charge-offs (NCOs) to $342.5 million, or
0.85% of average total loans and leases. Of this year’s NCOs, $34.6 million related to regulatory guidance
requiring consumer loans discharged under Chapter 7 bankruptcy to be charged down to collateral value.
Approximately 90% continue to make payments as scheduled. Importantly, nonperforming assets declined by
$144.5 million, or 25%, to $445.8 million and were at the lowest level since 2006.
Our tangible common equity ratio improved 46 basis points to 8.76%, and our Tier 1 common risk-based
capital ratio improved 48 basis points to 10.48% from December 31, 2011. For perspective, these are the highest
common equity based capital ratios for the Company in the last 20 years. The regulatory Tier 1 risk-based capital
ratio of 12.02% at December 31, 2012 remained over $2.9 billion above the “well-capitalized” regulatory
thresholds but was down from 12.11%, at December 31, 2011. This decline reflected capital actions taken
throughout the year, including the redemption of $230 million of trust preferred securities and the repurchase of
23.3 million common shares at an average price of $6.36 per share.
The full detail of our financial performance is discussed in the Management Discussion and Analysis
section found later in the attached SEC Form 10-K. Please take the opportunity to read this. It provides additional
insights and discussion related to our 2012 financial performance.
2013 Expectations
As we have done since early 2010, we will continue executing our core strategy, growing market share and
increasing the number of products cross sold through selective investments in initiatives to grow long-term
profitability. We will remain disciplined in our growth and pricing of loans and deposits and are encouraged by
the three basis points of net interest margin expansion during 2012. We continue to expect credit quality to
improve and net charge-offs should approach the higher end of our normalized levels of 35 to 55 basis points of
total loans by the end of 2013. We will stay focused on increasing customer cross-sell ratios and delivering
positive operating leverage.
Over the course of 2013, net interest income is expected to show modest improvement from the 2012 level.
We anticipate an increase in total loans, excluding the impact of any future loan securitizations, although we
expect growth will be more heavily weighted to the second half of the year. However, those benefits to net
interest income from higher balances are expected mostly to be offset by downward NIM pressure. NIM is not
expected to fall below the mid 3.30%’s due to continued deposit repricing and mix shift opportunities, while
maintaining a disciplined approach to loan pricing.
3