Huawei 2011 Annual Report Download - page 11
Download and view the complete annual report
Please find page 11 of the 2011 Huawei annual report below. You can navigate through the pages in the report by either clicking on the pages listed below, or by using the keyword search tool below to find specific information within the annual report.-
 1
1 -
 2
2 -
 3
3 -
 4
4 -
 5
5 -
 6
6 -
 7
7 -
 8
8 -
 9
9 -
 10
10 -
 11
11 -
 12
12 -
 13
13 -
 14
14 -
 15
15 -
 16
16 -
 17
17 -
 18
18 -
 19
19 -
 20
20 -
 21
21 -
 22
22 -
23
-
24
-
25
-
26
-
27
-
28
-
29
-
30
-
31
-
32
-
33
-
34
-
35
-
36
-
37
-
38
-
39
-
40
-
41
-
42
-
43
-
44
-
45
-
46
-
47
-
48
-
49
-
50
-
51
-
52
-
53
-
54
-
55
-
56
-
57
-
58
-
59
-
60
-
61
-
62
-
63
-
64
-
65
-
66
-
67
-
68
-
69
-
70
-
71
-
72
-
73
-
74
-
75
-
76
-
77
-
78
-
79
-
80
-
81
-
82
-
83
-
84
-
85
-
86
-
87
-
88
-
89
-
90
-
91
-
92
-
93
-
94
-
95
-
96
-
97
-
98
-
99
-
100
-
101
-
102
-
103
-
104
 |
 |

06
/
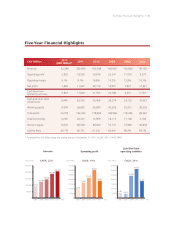
CAGR: 22% CAGR: 36%
0
50,000
100,000
150,000
200,000
250,000
92,155
123,080
146,607
182,548
203,929
2007 2008 2009 2010 2011
0
5,000
10,000
15,000
20,000
25,000
30,000
35,000
9,270
17,076
22,241
30,676
18,582
2007 2008 2009 2010 2011
0
5,000
10,000
15,000
20,000
25,000
30,000
35,000
5,197 4,561
24,188
31,555
17,826
2007 2008 2009 2010 2011
CAGR: 19%
CNY Million
Year
CNY Million CNY Million
Year Year
CNY Million 2011
(USD Million)* 2011 2010 2009 2008 2007
Revenue 32,396 203,929 182,548 146,607 123,080 92,155
Operating prot 2,952 18,582 30,676 22,241 17,076 9,270
Operating margin 9.1% 9.1% 16.8% 15.2% 13.9% 10.1%
Net prot 1,850 11,647 24,716 19,001 7,891 12,641
Cash ow from
operating activities 2,832 17,826 31,555 24,188 4,561 5,197
Cash and short term
investments 9,904 62,342 55,458 38,214 24,133 19,023
Working capital 9,004 56,681 60,899 43,286 25,921 28,228
Total assets 30,705 193,283 178,984 148,968 119,286 89,562
Total borrowings 3,229 20,327 12,959 16,115 17,148 5,700
Owner's equity 10,521 66,228 69,400 52,741 37,886 36,639
Liability Ratio 65.7% 65.7% 61.2% 64.6% 68.2% 59.1%
Five-Year Financial Highlights
Five-Year Financial Highlights
* Translated into US dollars using the closing rate as at December 31, 2011 of US$1.00 = CNY6.2949