Home Depot 2013 Annual Report Download - page 27
Download and view the complete annual report
Please find page 27 of the 2013 Home Depot annual report below. You can navigate through the pages in the report by either clicking on the pages listed below, or by using the keyword search tool below to find specific information within the annual report.-
 1
1 -
2
-
3
-
4
-
5
-
6
-
7
-
8
-
9
-
10
-
11
-
12
-
13
-
14
-
15
-
16
-
 17
17 -
 18
18 -
 19
19 -
 20
20 -
 21
21 -
 22
22 -
 23
23 -
 24
24 -
 25
25 -
 26
26 -
 27
27 -
 28
28 -
 29
29 -
 30
30 -
 31
31 -
 32
32 -
 33
33 -
 34
34 -
 35
35 -
 36
36 -
 37
37 -
38
-
39
-
40
-
41
-
42
-
43
-
44
-
45
-
46
-
47
-
48
-
49
-
50
-
51
-
52
-
53
-
54
-
55
-
56
-
57
-
58
-
59
-
60
-
61
-
62
-
63
-
64
-
65
-
66
 |
 |

22
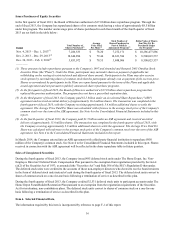
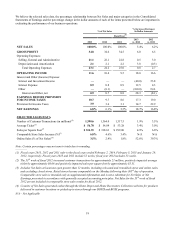
resulting from the positive comparable store sales environment, strong expense controls, and lower credit card expense and
casualty reserves, offset by the charge related to the China store closings.
Depreciation and Amortization was $1.6 billion for both fiscal 2012 and 2011. Depreciation and Amortization as a percent of
Net Sales was 2.1% for fiscal 2012 compared to 2.2% for fiscal 2011. The decrease in Depreciation and Amortization as a
percent of Net Sales reflects expense leverage in the positive comparable store sales environment.
Operating Income
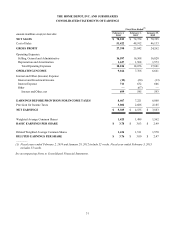
Operating Income increased 16.6% to $7.8 billion for fiscal 2012 from $6.7 billion for fiscal 2011. Operating Income as a
percent of Net Sales was 10.4% for fiscal 2012 compared to 9.5% for fiscal 2011. Excluding the charge related to the China
store closings, Operating Income increased 18.8% to $7.9 billion for fiscal 2012.
Interest and Other, net
In fiscal 2012, we recognized $545 million of Interest and Other, net, compared to $593 million for fiscal 2011. Interest and
Other, net, as a percent of Net Sales was 0.7% for fiscal 2012 compared to 0.8% for fiscal 2011. Interest and Other, net, for
fiscal 2012 included a $67 million pretax benefit related to the termination of our guarantee of a senior secured loan of HD
Supply, Inc.
Provision for Income Taxes
Our combined effective income tax rate was 37.2% for fiscal 2012 compared to 36.0% for fiscal 2011. The effective income
tax rate for fiscal 2012 was higher than fiscal 2011 as we were unable to realize any tax benefit from the $145 million charge
related to the China store closings. Excluding the charge related to the China store closings, our combined effective income
tax rate was 36.5% for fiscal 2012. Additionally, the effective income tax rate for fiscal 2011 reflects a benefit from the
reversal of a valuation allowance related to the utilization of capital loss carryforwards as well as certain favorable state and
local tax settlements.
Diluted Earnings per Share
Diluted Earnings per Share were $3.00 for fiscal 2012 compared to $2.47 for fiscal 2011. Excluding the charge related to the
China store closings, Diluted Earnings per Share were $3.10 for fiscal 2012. The 53rd week increased Diluted Earnings per
Share by approximately $0.07 for fiscal 2012.
Liquidity and Capital Resources
Cash flow generated from operations provides us with a significant source of liquidity. For fiscal 2013, Net Cash Provided by
Operating Activities was $7.6 billion compared to $7.0 billion for fiscal 2012. This increase is primarily due to an $850
million increase in Net Earnings resulting from higher comparable store sales and expense controls.
Net Cash Used in Investing Activities for fiscal 2013 was $1.5 billion compared to $1.4 billion for fiscal 2012. This change
was primarily due to a $77 million increase in Capital Expenditures in fiscal 2013 compared to fiscal 2012.
Net Cash Used in Financing Activities for fiscal 2013 was $6.7 billion compared to $5.0 billion for fiscal 2012. The year-
over-year increase of approximately $1.7 billion reflects a $4.6 billion increase in share repurchases, a $500 million increase
in dividends paid to shareholders and $543 million less in proceeds from the sale of common stock, offset for the most part
by $4.0 billion, net of repayments, of proceeds from long-term borrowings in fiscal 2013.
In February 2013, our Board of Directors authorized a new $17.0 billion share repurchase program, under which we have
repurchased 111 million shares of our common stock for a total of $8.5 billion as of the end of fiscal 2013. We entered into
ASR agreements with third-party financial institutions to repurchase $6.2 billion of our common stock in fiscal 2013. Under
the agreements, we paid $6.2 billion to the financial institutions and received a total of 81 million shares. Also in fiscal 2013,
we repurchased 30 million additional shares of our common stock for $2.3 billion through the open market.
In September 2013, we issued $1.15 billion of 2.25% senior notes due September 10, 2018 (the "2018 notes”) at a discount of
$1 million, $1.1 billion of 3.75% senior notes due February 15, 2024 (the "2024 notes”) at a discount of $6 million and $1.0
billion of 4.875% senior notes due February 15, 2044 (the "2044 notes”) at a discount of $15 million (together, the
"September 2013 issuance"). Interest on the 2018 notes is due semi-annually on March 10 and September 10 of each year,
beginning March 10, 2014. Interest on the 2024 notes and the 2044 notes is due semi-annually on February 15 and August 15
of each year, beginning February 15, 2014. The net proceeds of the September 2013 issuance were used for general corporate