Home Depot 2013 Annual Report Download - page 26
Download and view the complete annual report
Please find page 26 of the 2013 Home Depot annual report below. You can navigate through the pages in the report by either clicking on the pages listed below, or by using the keyword search tool below to find specific information within the annual report.-
 1
1 -
2
-
3
-
4
-
5
-
6
-
7
-
8
-
9
-
10
-
11
-
12
-
13
-
14
-
15
-
 16
16 -
 17
17 -
 18
18 -
 19
19 -
 20
20 -
 21
21 -
 22
22 -
 23
23 -
 24
24 -
 25
25 -
 26
26 -
 27
27 -
 28
28 -
 29
29 -
 30
30 -
 31
31 -
 32
32 -
 33
33 -
 34
34 -
 35
35 -
 36
36 -
37
-
38
-
39
-
40
-
41
-
42
-
43
-
44
-
45
-
46
-
47
-
48
-
49
-
50
-
51
-
52
-
53
-
54
-
55
-
56
-
57
-
58
-
59
-
60
-
61
-
62
-
63
-
64
-
65
-
66
 |
 |

21
Diluted Earnings per Share
Diluted Earnings per Share were $3.76 for fiscal 2013 compared to $3.00 for fiscal 2012. Excluding the charge related to the
China store closings, Diluted Earnings per Share were $3.10 for fiscal 2012. The 53rd week increased Diluted Earnings per
Share by approximately $0.07 for fiscal 2012.
Non-GAAP Measures
To provide clarity, internally and externally, about our operating performance, we supplement our reporting to exclude from
some GAAP measures certain items that we do not consider to be representative of our actual operating performance. These
financial calculations are "non-GAAP financial measures" as defined in SEC rules. We believe these non-GAAP financial
measures better enable management and investors to understand and analyze our performance by providing them with
meaningful information relevant to events of unusual nature or frequency that impact the comparability of underlying
business results from period to period. However, this supplemental information should not be considered in isolation or as a
substitute for the related GAAP measures.
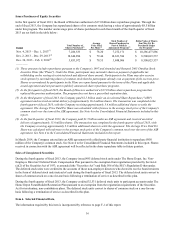
The results for fiscal 2012 included a $145 million charge, net of tax, related to the China store closings as described more
fully in Note 8 to the Consolidated Financial Statements. There were no adjustments for fiscal 2013 or 2011 for events of
unusual nature or frequency. The following reconciles the non-GAAP financial measures to the corresponding GAAP
measures for fiscal 2012 (amounts in millions, except per share data):
Fiscal Year Ended February 3, 2013
As
Reported Adjustments Non-GAAP
Measures % of
Net Sales
Gross Profit $ 25,842 $ (10) $ 25,852 34.6%
Selling, General and Administrative 16,508 135 16,373 21.9
Operating Income 7,766 (145) 7,911 10.6
Net Earnings 4,535 (145) 4,680 6.3%
Diluted Earnings per Share $ 3.00 $ (0.10) $ 3.10 N/A
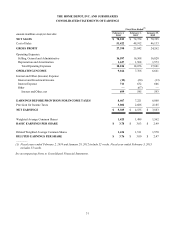
Fiscal 2012 Compared to Fiscal 2011
Net Sales
Fiscal 2012 consisted of 53 weeks compared to 52 weeks in fiscal 2011. Net Sales for fiscal 2012 increased 6.2% to $74.8
billion from $70.4 billion for fiscal 2011. The increase in Net Sales for fiscal 2012 reflects the impact of positive comparable
store sales and $1.2 billion of Net Sales attributable to the additional week in fiscal 2012. Total comparable store sales
increased 4.6% for fiscal 2012 compared to an increase of 3.4% for fiscal 2011.
The positive comparable store sales for fiscal 2012 reflect a number of factors including the execution of our key initiatives
and an improved U.S. housing market. All of our departments except for one posted positive comparable store sales for fiscal
2012, and comparable store average ticket increased 2.9% for fiscal 2012. Comparable store sales for our Lumber, Flooring,
Paint, Tools, Bath, Electrical, Lighting, Indoor Garden and Décor product categories were above or at the Company average
for fiscal 2012. Comparable store sales for our Hardware, Plumbing, Outdoor Garden, Kitchen and Millwork product
categories were positive for fiscal 2012. Comparable store sales for our Building Materials product category were negative
for fiscal 2012, reflecting the impact of weather and difficult year-over-year comparisons in roofing due to storm and repair
activity that drove sales in fiscal 2011.
Gross Profit
Gross Profit increased 6.5% to $25.8 billion for fiscal 2012 from $24.3 billion for fiscal 2011. Gross Profit for fiscal 2012
included a $10 million charge related to the China store closings. Gross Profit as a percent of Net Sales was 34.6% for fiscal
2012 compared to 34.5% for fiscal 2011, an increase of 10 basis points. The increase in gross profit margin in fiscal 2012 was
driven primarily by a change in mix of products sold and benefits from our supply chain transformation in the U.S.
Operating Expenses
SG&A increased 3.0% to $16.5 billion for fiscal 2012 from $16.0 billion for fiscal 2011. SG&A for fiscal 2012 included a
$135 million charge related to the China store closings. As a percent of Net Sales, SG&A was 22.1% for fiscal 2012
compared to 22.8% for fiscal 2011. Excluding the charge related to the China store closings, SG&A as a percent of Net Sales
was 21.9% for fiscal 2012. The decrease in SG&A as a percent of Net Sales for fiscal 2012 reflects expense leverage