Home Depot 2013 Annual Report Download - page 22
Download and view the complete annual report
Please find page 22 of the 2013 Home Depot annual report below. You can navigate through the pages in the report by either clicking on the pages listed below, or by using the keyword search tool below to find specific information within the annual report.-
 1
1 -
2
-
3
-
4
-
5
-
6
-
7
-
8
-
9
-
10
-
11
-
 12
12 -
 13
13 -
 14
14 -
 15
15 -
 16
16 -
 17
17 -
 18
18 -
 19
19 -
 20
20 -
 21
21 -
 22
22 -
 23
23 -
 24
24 -
 25
25 -
 26
26 -
 27
27 -
 28
28 -
 29
29 -
 30
30 -
 31
31 -
 32
32 -
33
-
34
-
35
-
36
-
37
-
38
-
39
-
40
-
41
-
42
-
43
-
44
-
45
-
46
-
47
-
48
-
49
-
50
-
51
-
52
-
53
-
54
-
55
-
56
-
57
-
58
-
59
-
60
-
61
-
62
-
63
-
64
-
65
-
66
 |
 |

17
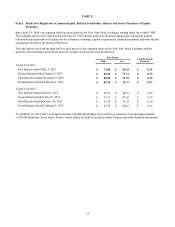
Item 7. Management’s Discussion and Analysis of Financial Condition and Results of Operations.
Executive Summary and Selected Consolidated Statements of Earnings Data
For the fiscal year ended February 2, 2014 ("fiscal 2013"), we reported Net Earnings of $5.4 billion and Diluted Earnings per
Share of $3.76 compared to Net Earnings of $4.5 billion and Diluted Earnings per Share of $3.00 for the fiscal year ended
February 3, 2013 ("fiscal 2012"). The results for fiscal 2012 included a total charge of $145 million, net of tax, related to the
closing of our remaining seven big box stores in China ("China store closings") in fiscal 2012, which had a negative impact
of $0.10 to Diluted Earnings per Share. Excluding the charge related to the China store closings, Net Earnings were $4.7
billion and Diluted Earnings per Share were $3.10 for fiscal 2012.
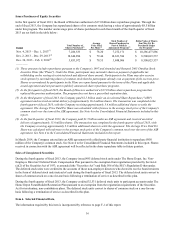
Net Sales increased 5.4% to $78.8 billion for fiscal 2013 from $74.8 billion for fiscal 2012. Our comparable store sales
increased 6.8% in fiscal 2013, driven by increased comparable store customer transactions and comparable store average
ticket. Comparable store sales for our U.S. stores increased 7.5% in fiscal 2013.
Fiscal 2013 consisted of 52 weeks compared with 53 weeks for fiscal 2012. The 53rd week added approximately $1.2 billion
in Net Sales and increased Diluted Earnings per Share by approximately $0.07 for fiscal 2012.
In fiscal 2013, we continued to focus on the following key initiatives:
Customer Service – Our focus on customer service is anchored on the principles of creating an emotional connection with
customers, putting customers first, taking care of our associates and simplifying the business. In fiscal 2013, we met our goal
of dedicating 60% of store labor hours to customer-facing activity, and we enhanced our Customer FIRST training for
associates to incorporate the interconnected retail experience. We also expanded our FIRST phones' functionality to process
Buy Online, Pick-up In Store ("BOPIS") and Buy Online, Ship to Store ("BOSS") orders, allowing our associates to close
these types of transactions immediately from wherever they are in the store. Also in fiscal 2013, we introduced Pro Xtra, a
new loyalty program that provides our professional customers with discounts on useful business services, exclusive product
offers and streamlined payment and receipt tracking tools.
Product Authority – Our focus on product authority is facilitated by our merchandising transformation and portfolio strategy,
which is aimed at delivering product innovation, assortment and value. As part of this effort, we introduced innovative new
products and great values for our professional, do-it-for-me and do-it-yourself customers in a variety of departments. Also in
fiscal 2013, we continued our appliance showroom resets and expanded our assortment of appliances available online,
resulting in double digit growth for appliances for fiscal 2013.
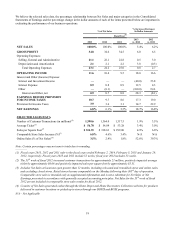
Disciplined Capital Allocation, Productivity and Efficiency – Our approach to driving productivity and efficiency is advanced
through continuous operational improvement in the stores and our supply chain, disciplined capital allocation and building
shareholder value through higher returns on invested capital and total value returned to shareholders in the form of dividends
and share repurchases. In fiscal 2013, we continued to make improvements to our forecasting and replenishment systems,
helping our business to react to and recover from sales spikes while keeping inventory under control. Our inventory turnover
ratio was 4.6 times at the end of fiscal 2013 compared to 4.5 times at the end of fiscal 2012.
We repurchased a total of 111 million shares for $8.5 billion through Accelerated Share Repurchase agreements and the open
market during fiscal 2013. In addition, in February 2014, we announced a 21% increase in our quarterly cash dividend to
$0.47 per share.
Interconnected Retail – Our focus on interconnected retail, which connects our other three key initiatives, is based on
building a competitive and seamless platform across all commerce channels. In fiscal 2013, we continued to enhance our
website and mobile experience resulting in improved customer satisfaction scores and online sales conversion rates. Sales
from our online channels increased over 50% for fiscal 2013 compared to fiscal 2012 and now represent approximately 3.5%
of our total Net Sales. We have also begun the development of three new direct fulfillment centers, the first of which opened
in February 2014. Each facility will have the capacity to hold approximately 100,000 product offerings available to be
shipped directly to customers, along with the capability to ship most orders the same day they are received.
In January 2014, we acquired Blinds.com, an online seller of window coverings. We believe that this acquisition will allow us
to offer customers a compelling shopping, sales and service experience for online window coverings purchases and help us to
develop best-in-class capabilities for selling customizable and configurable products online.
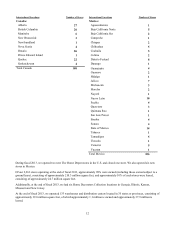
In fiscal 2013, we opened eight new stores, including six new stores in Mexico and two new stores in the U.S., and closed
one store in the U.S., for a total store count of 2,263 at the end of fiscal 2013. As of the end of fiscal 2013, a total of 286 of
our stores, or 12.6%, were located in Canada and Mexico.