FTD.com 2011 Annual Report Download - page 77
Download and view the complete annual report
Please find page 77 of the 2011 FTD.com annual report below. You can navigate through the pages in the report by either clicking on the pages listed below, or by using the keyword search tool below to find specific information within the annual report.-
 1
1 -
2
-
3
-
4
-
5
-
6
-
7
-
8
-
9
-
10
-
11
-
12
-
13
-
14
-
15
-
16
-
17
-
18
-
19
-
20
-
21
-
22
-
23
-
24
-
25
-
26
-
27
-
28
-
29
-
30
-
31
-
32
-
33
-
34
-
35
-
36
-
37
-
38
-
39
-
40
-
41
-
42
-
43
-
44
-
45
-
46
-
47
-
48
-
49
-
50
-
51
-
52
-
53
-
54
-
55
-
56
-
57
-
58
-
59
-
60
-
61
-
62
-
63
-
64
-
65
-
66
-
 67
67 -
 68
68 -
 69
69 -
 70
70 -
 71
71 -
 72
72 -
 73
73 -
 74
74 -
 75
75 -
 76
76 -
 77
77 -
 78
78 -
 79
79 -
 80
80 -
 81
81 -
 82
82 -
 83
83 -
 84
84 -
 85
85 -
 86
86 -
 87
87 -
88
-
89
-
90
-
91
-
92
-
93
-
94
-
95
-
96
-
97
-
98
-
99
-
100
-
101
-
102
-
103
-
104
-
105
-
106
-
107
-
108
-
109
-
110
-
111
-
112
-
113
-
114
-
115
-
116
-
117
-
118
-
119
-
120
-
121
-
122
-
123
-
124
-
125
-
126
-
127
-
128
-
129
-
130
-
131
-
132
-
133
-
134
-
135
-
136
-
137
-
138
-
139
-
140
-
141
-
142
-
143
-
144
-
145
-
146
-
147
-
148
-
149
-
150
-
151
-
152
-
153
-
154
-
155
-
156
-
157
-
158
-
159
-
160
-
161
-
162
-
163
-
164
-
165
-
166
-
167
-
168
-
169
-
170
-
171
-
172
 |
 |

Table of Contents
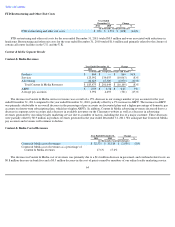
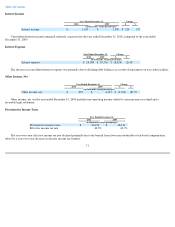
The decrease in Content & Media revenues was partially due to a decrease in services revenues. Services revenues decreased, despite a 2%
increase in our average number of pay accounts for the year ended December 31, 2010 compared to the year ended December 31, 2009, as a
result of a 13% decrease in ARPU for the year ended December 31, 2010 compared to the year ended December 31, 2009. The decrease in
ARPU was primarily attributable to a greater percentage of total pay accounts being represented by domestic discounted pricing plans and lower-
priced international subscription plans. In addition, Content & Media advertising revenues decreased by $16.5 million for the year ended
December 31, 2010, compared to the year ended December 31, 2009, primarily due to minimal revenues generated from post-
transaction sales in
the year ended December 31, 2010, partially offset by an increase in revenues generated from our online loyalty marketing service.
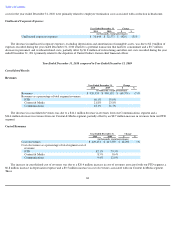
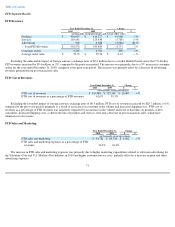
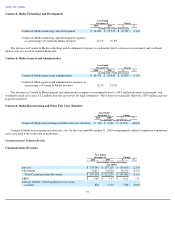
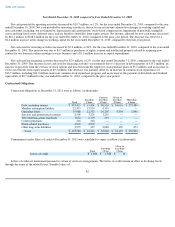
Content & Media Cost of Revenues
The increase in Content & Media cost of revenues was primarily due to a $1.5 million increase in the cost of points earned by members of
our online loyalty marketing service and a $0.7 million increase in overhead-related costs, partially offset by a $1.3 million decrease in credit
card processing fees and a $0.4 million decrease in personnel-related costs. The increase in cost of revenues as a percentage of Content & Media
revenues was primarily due to significantly lower revenues from post-transaction sales, which have minimal cost of revenues.
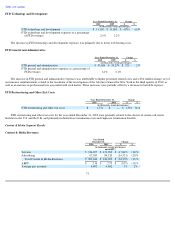
Content & Media Sales and Marketing
The decrease in Content & Media sales and marketing expenses was largely the result of an $11.8 million decrease in marketing costs to
acquire new online nostalgia services members and a $2.2 million decrease in personnel- and overhead-related costs as a result of reduced
headcount, partially offset by a $1.4 million increase in costs to acquire online loyalty marketing members and other sales and marketing costs.
74
Year Ended
December 31, Change
2010
2009
$
%
(in thousands, except percentages)
Content & Media cost of revenues
$
35,514
$
35,014
$
500
1
%
Content & Media cost of revenues as a percentage of
Content & Media revenues
17.6
%
14.8
%
Year Ended
December 31,
Change
2010
2009
$
%
(in thousands, except percentages)
Content & Media sales and marketing
$
62,226
$
74,819
$
(12,593
)
(17
)%
Content & Media sales and marketing expenses as a
percentage of Content & Media revenues
30.9
%
31.7
%