FTD.com 2011 Annual Report Download - page 50
Download and view the complete annual report
Please find page 50 of the 2011 FTD.com annual report below. You can navigate through the pages in the report by either clicking on the pages listed below, or by using the keyword search tool below to find specific information within the annual report.-
 1
1 -
2
-
3
-
4
-
5
-
6
-
7
-
8
-
9
-
10
-
11
-
12
-
13
-
14
-
15
-
16
-
17
-
18
-
19
-
20
-
21
-
22
-
23
-
24
-
25
-
26
-
27
-
28
-
29
-
30
-
31
-
32
-
33
-
34
-
35
-
36
-
37
-
38
-
39
-
 40
40 -
 41
41 -
 42
42 -
 43
43 -
 44
44 -
 45
45 -
 46
46 -
 47
47 -
 48
48 -
 49
49 -
 50
50 -
 51
51 -
 52
52 -
 53
53 -
 54
54 -
 55
55 -
 56
56 -
 57
57 -
 58
58 -
 59
59 -
 60
60 -
61
-
62
-
63
-
64
-
65
-
66
-
67
-
68
-
69
-
70
-
71
-
72
-
73
-
74
-
75
-
76
-
77
-
78
-
79
-
80
-
81
-
82
-
83
-
84
-
85
-
86
-
87
-
88
-
89
-
90
-
91
-
92
-
93
-
94
-
95
-
96
-
97
-
98
-
99
-
100
-
101
-
102
-
103
-
104
-
105
-
106
-
107
-
108
-
109
-
110
-
111
-
112
-
113
-
114
-
115
-
116
-
117
-
118
-
119
-
120
-
121
-
122
-
123
-
124
-
125
-
126
-
127
-
128
-
129
-
130
-
131
-
132
-
133
-
134
-
135
-
136
-
137
-
138
-
139
-
140
-
141
-
142
-
143
-
144
-
145
-
146
-
147
-
148
-
149
-
150
-
151
-
152
-
153
-
154
-
155
-
156
-
157
-
158
-
159
-
160
-
161
-
162
-
163
-
164
-
165
-
166
-
167
-
168
-
169
-
170
-
171
-
172
 |
 |

Table of Contents
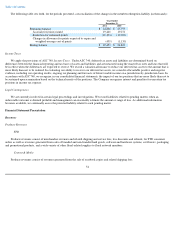
The pay accounts and ARPU metrics for our Content & Media segment may fluctuate significantly from period to period due to various
factors including, but not limited to, the extent to which discounted pricing is offered in prior and current periods, the percentage of pay accounts
being represented by international pay accounts which, on average, have lower-
priced subscription plans compared to U.S. pay accounts, and the
churn rate.
Critical Accounting Policies, Estimates and Assumptions
General
Our discussion and analysis of our financial condition and results of operations is based upon our audited consolidated financial statements,
which have been prepared in accordance with accounting principles generally accepted in the United States of America ("GAAP") and with the
instructions for Form 10-K and Article 10 of Regulation S-X issued by the SEC. The preparation of financial
48
Quarter Ended Year Ended December 31,
December 31,
2011
September 30,
2011
June 30,
2011
March 31,
2011
December 31,
2010
2011
2010
2009
Consolidated:
Revenues (in
thousands)
$
217,921
$
182,694
$
255,565
$
241,505
$
232,601
$
897,685
$
920,553
$
990,132
FTD:
Segment
revenues (in
thousands)
$
143,304
$
108,747
$
176,299
$
158,899
$
140,174
$
587,249
$
554,576
$
545,845
% of
consolidated
revenues
66
%
60
%
69
%
66
%
60
%
65
%
60
%
55
%
Consumer
orders (in
thousands)
1,615
1,104
2,167
1,742
1,612
6,628
6,361
6,071
Average order
value
$
62.31
$
63.46
$
60.45
$
63.28
$
60.43
$
62.15
$
59.72
$
59.56
Average
currency
exchange
rate: GBP to
USD
1.57
1.61
1.63
1.61
1.58
1.61
1.54
1.55
Content &
Media:
Segment
revenues (in
thousands)
$
45,665
$
44,070
$
47,427
$
48,313
$
53,253
$
185,475
$
201,644
$
236,022
% of
consolidated
revenues
21
%
24
%
19
%
20
%
23
%
21
%
22
%
24
%
Pay accounts (in
thousands)
3,484
3,780
4,007
4,260
4,499
3,484
4,499
4,886
Segment churn
4.1
%
3.9
%
3.8
%
3.9
%
4.1
%
3.9
%
3.6
%
4.0
%
ARPU
$
2.60
$
2.64
$
2.60
$
2.47
$
2.42
$
2.59
$
2.38
$
2.75
Segment active
accounts (in
millions)
10.3
11.9
12.5
13.6
13.7
12.1
15.6
17.4
Average
currency
exchange
rate: EUR to
USD
1.35
1.41
1.44
1.37
1.36
1.39
1.33
1.50
Communications:
Segment
revenues (in
thousands)
$
29,295
$
30,260
$
32,279
$
34,698
$
39,708
$
126,532
$
167,153
$
211,233
% of
consolidated
revenues
13
%
17
%
13
%
14
%
17
%
14
%
18
%
21
%
Pay accounts (in
thousands):
Access
535
577
622
675
732
535
732
1,036
Other
259
266
272
279
288
259
288
314
Total pay
accounts
794
843
894
954
1,020
794
1,020
1,350
Segment churn
3.4
%
3.4
%
3.5
%
3.8
%
3.8
%
3.5
%
4.1
%
4.7
%
ARPU
$
9.09
$
9.14
$
9.28
$
9.33
$
9.46
$
9.14
$
9.49
$
9.47
Segment active
accounts (in
millions)
1.5
1.6
1.7
1.7
1.8
1.6
2.0
2.4