FTD.com 2011 Annual Report Download - page 69
Download and view the complete annual report
Please find page 69 of the 2011 FTD.com annual report below. You can navigate through the pages in the report by either clicking on the pages listed below, or by using the keyword search tool below to find specific information within the annual report.-
 1
1 -
2
-
3
-
4
-
5
-
6
-
7
-
8
-
9
-
10
-
11
-
12
-
13
-
14
-
15
-
16
-
17
-
18
-
19
-
20
-
21
-
22
-
23
-
24
-
25
-
26
-
27
-
28
-
29
-
30
-
31
-
32
-
33
-
34
-
35
-
36
-
37
-
38
-
39
-
40
-
41
-
42
-
43
-
44
-
45
-
46
-
47
-
48
-
49
-
50
-
51
-
52
-
53
-
54
-
55
-
56
-
57
-
58
-
 59
59 -
 60
60 -
 61
61 -
 62
62 -
 63
63 -
 64
64 -
 65
65 -
 66
66 -
 67
67 -
 68
68 -
 69
69 -
 70
70 -
 71
71 -
 72
72 -
 73
73 -
 74
74 -
 75
75 -
 76
76 -
 77
77 -
 78
78 -
 79
79 -
80
-
81
-
82
-
83
-
84
-
85
-
86
-
87
-
88
-
89
-
90
-
91
-
92
-
93
-
94
-
95
-
96
-
97
-
98
-
99
-
100
-
101
-
102
-
103
-
104
-
105
-
106
-
107
-
108
-
109
-
110
-
111
-
112
-
113
-
114
-
115
-
116
-
117
-
118
-
119
-
120
-
121
-
122
-
123
-
124
-
125
-
126
-
127
-
128
-
129
-
130
-
131
-
132
-
133
-
134
-
135
-
136
-
137
-
138
-
139
-
140
-
141
-
142
-
143
-
144
-
145
-
146
-
147
-
148
-
149
-
150
-
151
-
152
-
153
-
154
-
155
-
156
-
157
-
158
-
159
-
160
-
161
-
162
-
163
-
164
-
165
-
166
-
167
-
168
-
169
-
170
-
171
-
172
 |
 |

Table of Contents
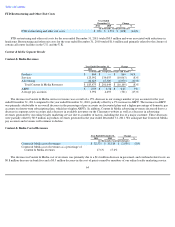
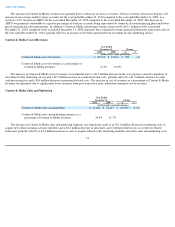
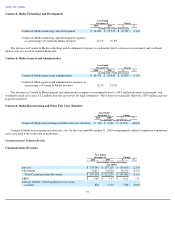
Content & Media restructuring and other exit costs for the year ended December 31, 2011 were primarily related to employee termination
costs associated with a reduction in headcount during the fourth quarter of 2011.
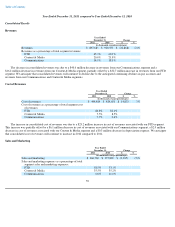
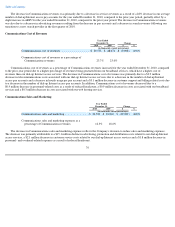
Communications Segment Results
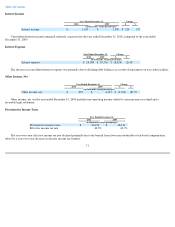
Communications Revenues
The decrease in Communications services revenues was primarily due to a 30% decrease in our average number of dial-up Internet access
pay accounts for the year ended December 31, 2011, compared to the year ended December 31, 2010, as well as a 4% decrease in ARPU. The
decrease in ARPU is attributable to a higher percentage of pay accounts on lower-priced or discounted subscription plans or services. The
decrease in Communications advertising revenues was primarily due to the decrease in pay accounts. We anticipate that Communications pay
accounts, revenues and ARPU will continue to decline.
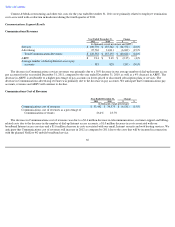
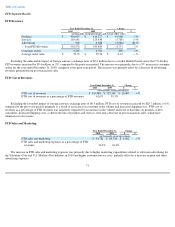
Communications Cost of Revenues
The decrease in Communications cost of revenues was due to a $3.4 million decrease in telecommunications, customer support and billing-
related costs due to the decrease in the number of dial-up Internet access accounts, a $1.0 million decrease in costs associated with our
broadband Internet access services and a $1.6 million decrease in costs associated with our email, Internet security and web hosting services. We
anticipate that Communications cost of revenues will increase in 2012 as compared to 2011 due to the costs that will be incurred in connection
with the planned NetZero 4G mobile broadband service.
66
Year Ended December 31,
Change
2011
2010
$
%
(in thousands, except percentages and ARPU)
Services
$
100,770
$
135,342
$
(34,572
)
(26
)%
Advertising
25,762
31,811
(6,049
)
(19
)%
Total Communications Revenues
$
126,532
$
167,153
$
(40,621
)
(24
)%
ARPU
$
9.14
$
9.49
$
(0.35
)
(4
)%
Average number of dial-up Internet access pay
accounts
583
828
(245
)
(30
)%
Year Ended December 31,
Change
2011
2010
$
%
(in thousands, except percentages)
Communications cost of revenues
$
33,442
$
39,573
$
(6,131
)
(15
)%
Communications cost of revenues as a percentage of
Communications revenues
26.4
%
23.7
%