FTD.com 2011 Annual Report Download - page 72
Download and view the complete annual report
Please find page 72 of the 2011 FTD.com annual report below. You can navigate through the pages in the report by either clicking on the pages listed below, or by using the keyword search tool below to find specific information within the annual report.-
 1
1 -
2
-
3
-
4
-
5
-
6
-
7
-
8
-
9
-
10
-
11
-
12
-
13
-
14
-
15
-
16
-
17
-
18
-
19
-
20
-
21
-
22
-
23
-
24
-
25
-
26
-
27
-
28
-
29
-
30
-
31
-
32
-
33
-
34
-
35
-
36
-
37
-
38
-
39
-
40
-
41
-
42
-
43
-
44
-
45
-
46
-
47
-
48
-
49
-
50
-
51
-
52
-
53
-
54
-
55
-
56
-
57
-
58
-
59
-
60
-
61
-
 62
62 -
 63
63 -
 64
64 -
 65
65 -
 66
66 -
 67
67 -
 68
68 -
 69
69 -
 70
70 -
 71
71 -
 72
72 -
 73
73 -
 74
74 -
 75
75 -
 76
76 -
 77
77 -
 78
78 -
 79
79 -
 80
80 -
 81
81 -
 82
82 -
83
-
84
-
85
-
86
-
87
-
88
-
89
-
90
-
91
-
92
-
93
-
94
-
95
-
96
-
97
-
98
-
99
-
100
-
101
-
102
-
103
-
104
-
105
-
106
-
107
-
108
-
109
-
110
-
111
-
112
-
113
-
114
-
115
-
116
-
117
-
118
-
119
-
120
-
121
-
122
-
123
-
124
-
125
-
126
-
127
-
128
-
129
-
130
-
131
-
132
-
133
-
134
-
135
-
136
-
137
-
138
-
139
-
140
-
141
-
142
-
143
-
144
-
145
-
146
-
147
-
148
-
149
-
150
-
151
-
152
-
153
-
154
-
155
-
156
-
157
-
158
-
159
-
160
-
161
-
162
-
163
-
164
-
165
-
166
-
167
-
168
-
169
-
170
-
171
-
172
 |
 |

Table of Contents
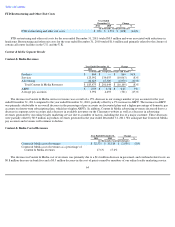
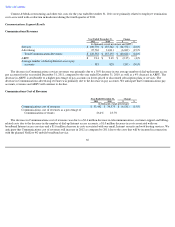
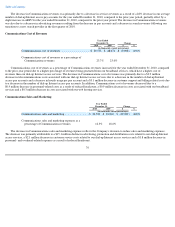
increases were partially offset by a $9.1 million decrease in cost of revenues associated with our Communications segment.
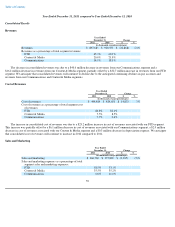
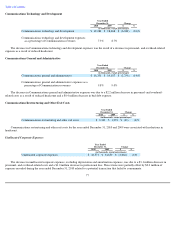
Sales and Marketing
The decrease in consolidated sales and marketing expenses was due to a $19.3 million decrease in sales and marketing expenses associated
with our Communications segment and a $12.6 million decrease in sales and marketing expenses associated with our Content & Media segment.
These decreases were partially offset by a $4.1 million increase in sales and marketing expenses associated with our FTD segment and a
$0.3 million increase in depreciation expense.
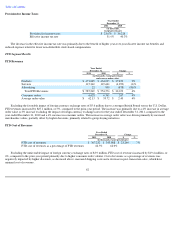
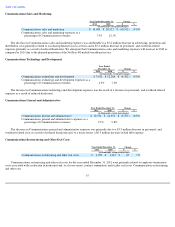
Technology and Development
The decrease in consolidated technology and development expenses was primarily related to a $6.2 million decrease in technology and
development expenses associated with our Communications segment, a $2.7 million decrease in technology and development expenses
associated with our Content & Media segment and a $0.7 million decrease in technology and development expenses associated with our FTD
segment. These decreases were partially offset by a $0.8 million increase in depreciation expense.
69
Year Ended December 31, Change
2010
2009
$
%
(in thousands, except percentages)
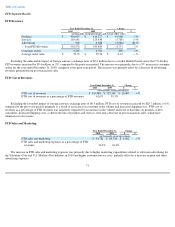
Sales and marketing
$
175,865
$
202,810
$
(26,945
)
(13
)%
Sales and marketing expenses as a percentage of total
segment sales and marketing expenses:
FTD
53.1
%
43.9
%
Content & Media
35.2
%
36.6
%
Communications
11.6
%
19.5
%
Year Ended December 31,
Change
2010
2009
$
%
(in thousands, except percentages)
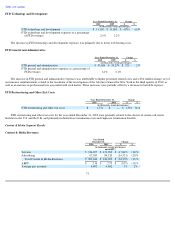
Technology and development
$
55,381
$
64,158
$
(8,777
)
(14
)%
Technology and development expenses as a percentage of
total segment technology and development expenses:
FTD
24.2
%
21.2
%
Content & Media
49.3
%
45.7
%
Communications
26.5
%
33.1
%