EasyJet 2011 Annual Report Download - page 26
Download and view the complete annual report
Please find page 26 of the 2011 EasyJet annual report below. You can navigate through the pages in the report by either clicking on the pages listed below, or by using the keyword search tool below to find specific information within the annual report.-
 1
1 -
2
-
3
-
4
-
5
-
6
-
7
-
8
-
9
-
10
-
11
-
12
-
13
-
14
-
15
-
 16
16 -
 17
17 -
 18
18 -
 19
19 -
 20
20 -
 21
21 -
 22
22 -
 23
23 -
 24
24 -
 25
25 -
 26
26 -
 27
27 -
 28
28 -
 29
29 -
 30
30 -
 31
31 -
 32
32 -
 33
33 -
 34
34 -
 35
35 -
 36
36 -
37
-
38
-
39
-
40
-
41
-
42
-
43
-
44
-
45
-
46
-
47
-
48
-
49
-
50
-
51
-
52
-
53
-
54
-
55
-
56
-
57
-
58
-
59
-
60
-
61
-
62
-
63
-
64
-
65
-
66
-
67
-
68
-
69
-
70
-
71
-
72
-
73
-
74
-
75
-
76
-
77
-
78
-
79
-
80
-
81
-
82
-
83
-
84
-
85
-
86
-
87
-
88
-
89
-
90
-
91
-
92
-
93
-
94
-
95
-
96
-
97
-
98
-
99
-
100
-
101
-
102
-
103
-
104
-
105
-
106
-
107
-
108
 |
 |

24
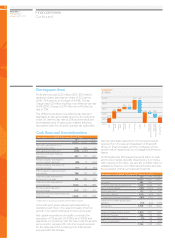
Financial review
Continued
easyJet plc
Annual report
and accounts 2011
Earnings per share
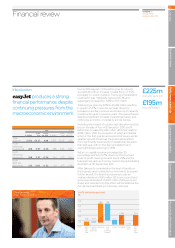
Profit after tax was £225 million (2010: £121 million)
resulting in basic earnings per share of 52.5 pence
(2010: 28.4 pence), an increase of 84.9%. The tax
charge was £23 million resulting in an effective tax rate
of 9% (2010: charge of £33 million and effective tax
rate of 21%.
The difference between the effective tax rate and
standard UK rate is principally driven by the reduction
inthe UK deferred tax rate to 25% and the resolution
and reassessment of various tax matters following
discussions with the UK and European tax authorities.
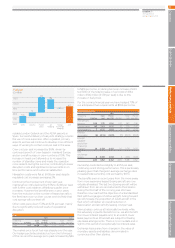
Cash flows and financial position
Summary consolidated statement of cash flows
2011 2010 Change
£ million £ million £ million
Net cash generated from
operating activities 424 363 61
Net capital expenditure * (478) (482) 4
Net loan and lease finance
drawdown 357 177 180
Net (increase) / decrease in
money market deposits (38) 31 (69)
Other including the effect of
exchange rates (77) 34 (111)
Net increase in cash and cash
equivalents 188 123 65
Cash and cash equivalents
at beginning of year 912 789 123
Cash and cash equivalents
at end of year 1,100 912 188
Money market deposits
at end of year 300 260 40
Cash and money market deposits
at end of year 1,400 1,172 228
*stated net of disposal proceeds of £75 million in 2011.
In line with prior years, easyJet generated strong
operating cash flow in the year principally driven by
growth in forward bookings and revenue per seat.
Net capital expenditure principally comprises the
acquisition of 25 aircraft (13 A319 and 12 A320) and
payments in connection with the new order for aircraft
announced in January 2011; net of proceeds received
for the disposal of the remaining four A321 aircraft
acquired with GB Airways.
Net loan and lease drawdown comprised proceeds
received from the sale and leaseback of 18 aircraft
(three on finance leases), and the mortgage of nine
aircraft, net of repayments on mortgages and finance
leases.
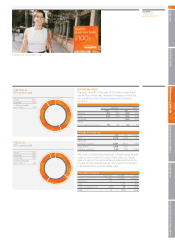
At 30 September 2011 easyJet had £1.4 billion of cash
and money market deposits. Board policy is to hold a
cash reserve of £4 million per aircraft, so £584 million is
available to finance committed aircraft orders and pay
the proposed ordinary and special dividends.
Summary consolidated statement of financial position
2011 2010 Change
£ million £ million £ million
Goodwill 365 365 –
Property, plant and equipment 2,149 1,928 221
Net working capital (765) (590) (175)
Restricted cash 123 56 67
Net cash / (debt) 100 (40) 140
Current and deferred taxation (188) (176) (12)
Other non-current assets and
liabilities (79) (42) (37)
Net assets 1,705 1,501 204
Opening shareholders’ equity 1,501 1,307 194
Profit for the year 225 121 104
Change in hedging reserve (21) 59 (80)
Other movements –14 (14)
1,705 1,501 204
2,000
1,800
1,600
1,400
1,200
1,000
Cash flow
£ million
84 91
90
150451,400
1,205
357 481
1,172
269
Working
capital
Other
Depn &
amort
Capex
2011 proforma
Proposed
special devidend
Proposed
ordinary dividend
Financing
2010*
2011*
Operating
profit