EasyJet 2011 Annual Report Download - page 25
Download and view the complete annual report
Please find page 25 of the 2011 EasyJet annual report below. You can navigate through the pages in the report by either clicking on the pages listed below, or by using the keyword search tool below to find specific information within the annual report.-
 1
1 -
2
-
3
-
4
-
5
-
6
-
7
-
8
-
9
-
10
-
11
-
12
-
13
-
14
-
 15
15 -
 16
16 -
 17
17 -
 18
18 -
 19
19 -
 20
20 -
 21
21 -
 22
22 -
 23
23 -
 24
24 -
 25
25 -
 26
26 -
 27
27 -
 28
28 -
 29
29 -
 30
30 -
 31
31 -
 32
32 -
 33
33 -
 34
34 -
 35
35 -
36
-
37
-
38
-
39
-
40
-
41
-
42
-
43
-
44
-
45
-
46
-
47
-
48
-
49
-
50
-
51
-
52
-
53
-
54
-
55
-
56
-
57
-
58
-
59
-
60
-
61
-
62
-
63
-
64
-
65
-
66
-
67
-
68
-
69
-
70
-
71
-
72
-
73
-
74
-
75
-
76
-
77
-
78
-
79
-
80
-
81
-
82
-
83
-
84
-
85
-
86
-
87
-
88
-
89
-
90
-
91
-
92
-
93
-
94
-
95
-
96
-
97
-
98
-
99
-
100
-
101
-
102
-
103
-
104
-
105
-
106
-
107
-
108
 |
 |

easyJet plc
Annual report
and accounts 2011
Overview Business review Performance and risk Corporate responsibility Governance Accounts & other information
23
notably London Gatwick and the AENA airports in
Spain. Successful delivery of easyJet’s strategy requires
the use of more expensive, often regulated, primary
airports, and we will continue to develop more efficient
ways of working to contain cost per seat in this area.
Crew cost per seat increased by 8.6%, driven by
continued growth of crew based in mainland Europe
and an overall increase in crew numbers of 19%. This
increase in headcount allowed us to increase the
number of standby crews and made the operation
more resilient during the summer, contributing to lower
disruption costs and significant improvements in on
time performance and customer satisfaction.
Navigation costs were flat at £4.56 per seat despite
regulated cost increases averaging 2%.
Continuing the improvement shown last year,
maintenance costs declined by 9.5% to £2.86 per seat,
with further cost initiatives offsetting supplier price
increases. However the benefits seen in prior years
from the reduction in the number of leased aircraft in
the fleet have now run their course, and it is likely that
cost savings will now level off.
Other costs were down 17.2% at £2.74 per seat, mainly
due to significantly reduced levels of operational
disruption.
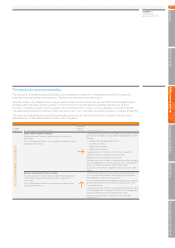
Fuel
2011 2010
Underlying
costs * £ million
£ per
seat
Pence
per ASK £ million
£ per
seat
Pence
per ASK
Fuel 917 14.68 1.32 733 13.09 1.17
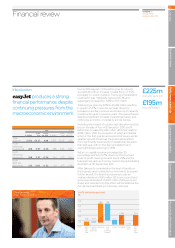
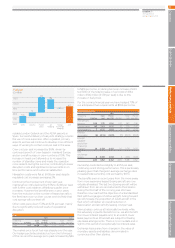
The market price for jet fuel rose sharply over the year.
Our hedging activities shielded us from the full impact
of this rise and the average price paid increased by $86
to $818 per tonne; in sterling terms an increase of £63
to £508. Of the total increase in fuel costs of £184
million, £100 million (£1.59 per seat) is due to this
increase in fuel prices.
For the coming financial year we have hedged 73% of
our anticipated fuel requirements at $956 per tonne.
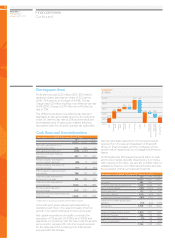
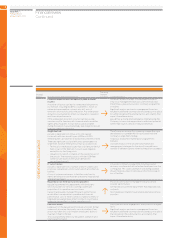
Ownership costs
2011 2010
Underlying
costs * £ million
£ per
seat
Pence
per ASK £ million
£ per
seat
Pence
per ASK
Aircraft dry
leasing 109 1.75 0.16 102 1.82 0.16
Depreciation 83 1.33 0.12 72 1.29 0.12
Amortisation 70.12 0.01 60.110.01
Interest
receivable (9) (0.15) (0.01) (7) (0.13) (0.01)
Interest
payable
and other
financing
charges 24 0.38 0.03 20 0.36 0.03
Net
exchange
losses 6 0.09 0.01 70.13 0.01
220 3.52 0.32 200 3.58 0.32
Ownership costs declined slightly to £3.52 per seat;
continuing recent strong performance. This is particularly
pleasing given that changes in average exchange rates
increased total ownership cost per seat by £0.13.
The benefits seen in recent years from the move away
from more expensive leased Boeing aircraft are now
virtually all realised. The last two Boeing aircraft will be
withdrawn from service and returned to their lessors
during the first half of the coming year. We have
therefore now reached the objective of a standardised
fleet with two gauges of Airbus aircraft. Going forward
we will increase the proportion of A320 aircraft in the
fleet which will deliver an overall reduction in
depreciation and aircraft dry leasing cost per seat.
Interest rates continue at historically low levels; while
this adversely impacts interest income, we also benefit
from lower interest payable and, to an extent, lower
lease payments as 20 aircraft are subject to floating
rate lease arrangements. There is no immediate end in
sight to this period of exceptionally low interest rates.
Exchange losses arise from changes in the value of
monetary assets and liabilities denominated in
currencies other than sterling.
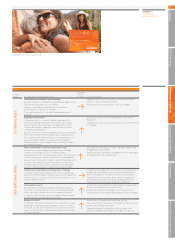
1,100
1,000
900
800
700
600
Fuel cost
£ million
186
6
292
917
733
72
Jet
hedging
Foreign
exchange
hedging
Market
price
20112010 Volume