EasyJet 2011 Annual Report Download - page 24
Download and view the complete annual report
Please find page 24 of the 2011 EasyJet annual report below. You can navigate through the pages in the report by either clicking on the pages listed below, or by using the keyword search tool below to find specific information within the annual report.-
 1
1 -
2
-
3
-
4
-
5
-
6
-
7
-
8
-
9
-
10
-
11
-
12
-
13
-
 14
14 -
 15
15 -
 16
16 -
 17
17 -
 18
18 -
 19
19 -
 20
20 -
 21
21 -
 22
22 -
 23
23 -
 24
24 -
 25
25 -
 26
26 -
 27
27 -
 28
28 -
 29
29 -
 30
30 -
 31
31 -
 32
32 -
 33
33 -
 34
34 -
35
-
36
-
37
-
38
-
39
-
40
-
41
-
42
-
43
-
44
-
45
-
46
-
47
-
48
-
49
-
50
-
51
-
52
-
53
-
54
-
55
-
56
-
57
-
58
-
59
-
60
-
61
-
62
-
63
-
64
-
65
-
66
-
67
-
68
-
69
-
70
-
71
-
72
-
73
-
74
-
75
-
76
-
77
-
78
-
79
-
80
-
81
-
82
-
83
-
84
-
85
-
86
-
87
-
88
-
89
-
90
-
91
-
92
-
93
-
94
-
95
-
96
-
97
-
98
-
99
-
100
-
101
-
102
-
103
-
104
-
105
-
106
-
107
-
108
 |
 |

22
Financial review
Continued
easyJet plc
Annual report
and accounts 2011
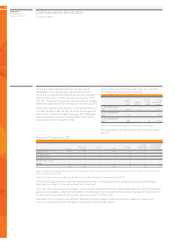
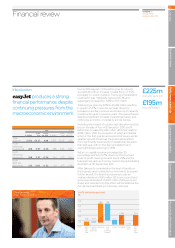
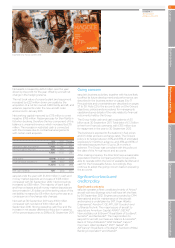
Financial performance
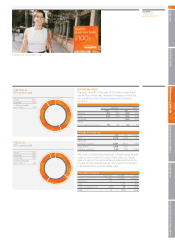
Revenue
2011 2010
£ million
£ per
seat
Pence
per ASK £ million
£ per
seat
Pence
per ASK
Passenger
revenue 2,733 43.75 3.94 2,402 42.87 3.81
Ancillary
revenue 719 11.52 1.04 571 10.20 0.91
Tota l
revenue 3,452 55.27 4.98 2,973 53.07 4.72
Revenue per seat improved by 4.1% compared with last
year reflecting a strong summer performance from the
UK and the steady maturing of significant capacity
investments made in mainland Europe during the last
few years.
Passenger revenue contributed 2% of this increase,
held back by significant increases in APD, VAT and
similar taxes levied on passengers. Overall these taxes,
driven by a further increase in UK APD and the
introduction of APD in Germany, increased by 19.8%
to £6.26 per seat.
We remain convinced that taxes of this nature are a
blunt instrument that does not achieve their stated
objective and will continue to press our case for such
taxes to be levied on aircraft and not passengers.
Ancillary revenue grew strongly, up by 12.9% to £11.52 per
seat. This improvement was driven by the introduction
ofhigher charges for hold baggage on longer sectors,
and revised speedy boarding and booking fees.
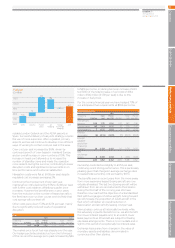
Costs
2011 2010
Underlying
costs * £ million
£ per
seat
Pence
per ASK £ million
£ per
seat
Pence
per ASK
Operating
costs
excluding
fuel 2,067 33.10 2.98 1,852 33.04 2.94
Fuel 917 14.68 1.32 733 13.09 1.17
Ownership
costs 220 3.52 0.32 200 3.58 0.32
Total costs 3,204 51.30 4.62 2,785 49.71 4.43
Total costs
excluding
fuel 2,287 36.62 3.30 2,052 36.62 3.26
* Underlying measures exclude (in 2010) costs of £27 million relating
to the volcanic ash cloud and a loss of £7 million on disposal of four
A321 aircraft. There are no underlying adjustments made in 2011.
Total cost per seat increased by 3.2% to £51.30;
however excluding fuel, cost per seat was flat at
£36.62, and down by 1.3% at constant currency. This
result was driven by savings from renegotiation of key
contracts with ground handlers and lower levels of
operational disruption, offset by some significant price
increases at regulated airports and planned investment
in crew standby levels.
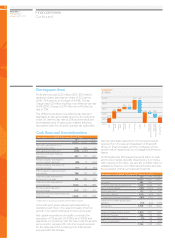
Operating costs excluding fuel
2011 2010
Underlying
costs * £ million
£ per
seat
Pence
per ASK £ million
£ per
seat
Pence
per ASK
Ground
operations 923 14.79 1.33 805 14.36 1.28
Crew 407 6.51 0.58 336 6.00 0.53
Navigation 285 4.56 0.41 256 4.57 0.41
Maintenance 179 2.86 0.26 177 3.16 0.28
Selling and
marketing 102 1.64 0.15 92 1.64 0.14
Other costs 171 2.74 0.25 186 3.31 0.30
2,067 33.10 2.98 1,852 33.04 2.94
Operating costs per seat excluding fuel increased by
0.2% to £33.10. At constant currency, operating costs
per seat excluding fuel fell by 0.9% to £32.75 per seat.
Ground operations cost per seat increased by 3.0% of
which around half was due to changes in exchange
rates. Good progress was made in renegotiating
contracts with ground handlers and reducing the use
of optional services at airports, however this was more
than offset by price increases at regulated airports,