EasyJet 2011 Annual Report Download - page 18
Download and view the complete annual report
Please find page 18 of the 2011 EasyJet annual report below. You can navigate through the pages in the report by either clicking on the pages listed below, or by using the keyword search tool below to find specific information within the annual report.-
 1
1 -
2
-
3
-
4
-
5
-
6
-
7
-
 8
8 -
 9
9 -
 10
10 -
 11
11 -
 12
12 -
 13
13 -
 14
14 -
 15
15 -
 16
16 -
 17
17 -
 18
18 -
 19
19 -
 20
20 -
 21
21 -
 22
22 -
 23
23 -
 24
24 -
 25
25 -
 26
26 -
 27
27 -
 28
28 -
29
-
30
-
31
-
32
-
33
-
34
-
35
-
36
-
37
-
38
-
39
-
40
-
41
-
42
-
43
-
44
-
45
-
46
-
47
-
48
-
49
-
50
-
51
-
52
-
53
-
54
-
55
-
56
-
57
-
58
-
59
-
60
-
61
-
62
-
63
-
64
-
65
-
66
-
67
-
68
-
69
-
70
-
71
-
72
-
73
-
74
-
75
-
76
-
77
-
78
-
79
-
80
-
81
-
82
-
83
-
84
-
85
-
86
-
87
-
88
-
89
-
90
-
91
-
92
-
93
-
94
-
95
-
96
-
97
-
98
-
99
-
100
-
101
-
102
-
103
-
104
-
105
-
106
-
107
-
108
 |
 |

16
easyJet plc
Annual report
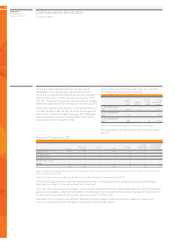
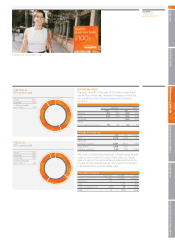
and accounts 2011 Key performance indicators
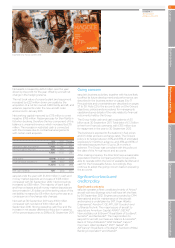
We monitor the performance of the business and
performance against our strategic objectives using
the following key performance indicators.
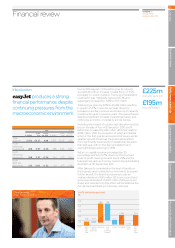
Financial
discipline
We are committed
to improving
shareholder returns
whilst remaining
prudently financed
with a strong, liquid
balance sheet.
Safe and
sustainable
No compromise
on safety
We will never
compromise our
commitment to
safety, which is always
the first priority for
all our people.
+4.1%
2009
2010
2011
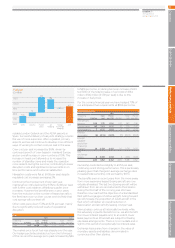
Revenue per seat
£
55.27
53.07
50.47
Flat
2009
2010
2011
Cost per seat excluding fuel (underlying)
£
36.62
36.62
34.36
2007
2008 29.49
26.55
+17.9%
2009
2010
2011
Profit before tax (underlying) / per seat
£
3.97
3.36
0.83
2007
2008 2.37
4.30
+3.9ppt
2009
2010
2011
Return on capital employed
ppt
12.7
8.8
3.6
2007
2008 7.3
11.7
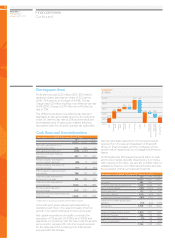
-4ppt
2009
2010
2011
Gearing
ppt
28
32
38
2007
2008 29
20
+£140m
2009
2010
2011
Net cash
£ million
100
-40
-46
2007
2008 236
393
Composite risk value (CRV) index
0.2
0.0
0.4
0.6
0.8
1.0
1.2
Oct
08
Feb
09
Jun
09
Oct
09
Feb
10
Jun
10
Oct
10
Feb
11
Jun
11
Dec
08
Apr
09
Aug
09
Dec
09
Apr
10
Aug
10
Dec
10
Apr
11
Aug
11
0.629
Control carbon
footprint
We control our fuel
usage on our flights.
715
2009
2010
2011
Fuel burn
(USG/BH)
715
715
715