Duke Energy 2009 Annual Report Download - page 7
Download and view the complete annual report
Please find page 7 of the 2009 Duke Energy annual report below. You can navigate through the pages in the report by either clicking on the pages listed below, or by using the keyword search tool below to find specific information within the annual report.-
 1
1 -
 2
2 -
 3
3 -
 4
4 -
 5
5 -
 6
6 -
 7
7 -
 8
8 -
 9
9 -
 10
10 -
 11
11 -
 12
12 -
 13
13 -
 14
14 -
 15
15 -
 16
16 -
 17
17 -
 18
18 -
19
-
20
-
21
 |
 |

6 DUKE ENERGY CORPORATION / 2009 ANNUAL REPORT
LETTER TO STAKEHOLDERS (CONTINUED)
Our strategies are clear:
Modernize our facilities to repower the regions we serve,
■
improve reliability, create new jobs and reduce our
environmental impact.
Execute on a new regulatory model for energy efficiency
■
to help our customers save money and make the
communities we serve more energy efficient.
Keep our commercial businesses profitable and
■
focused on earning solid economic returns.
Engage on the front lines of the climate change, ■
energy and environmental debates to help protect
the interests of our stakeholders, especially our
customers and investors.
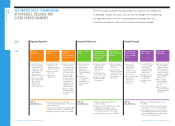
The table on pages 2 and 3 of this report summarizes
our strategic initiatives, which I discuss in greater detail
below. Some of these are early-stage initiatives designed to
create options, such as our ongoing efforts to expand energy
efficiency. Some remain central to our strategy regardless
of what happens, such as modernizing our generation fleet
and our grid, and expanding our renewable energy portfolio.
Finally, other initiatives, such as our proposed nuclear
plant projects, have a longer time frame. To succeed in
these efforts, we must be alert to changes that may require
course adjustments.
2009 RESULTS
Last year was difficult for both our customers and our
industry. On a weather-normalized basis, our customers’
demand for power was down approximately 4 percent,
primarily due to declines in manufacturing load. Cooler
summers in both the Midwest and the Southeast also
reduced electricity demand.
We can’t control the economy or the weather, so
throughout the year, we focused on what we could control.
We aggressively managed our costs — reducing our
planned operating and maintenance expenses by more
than $150 million, exceeding our $100 million target.
Our regulated operations also maintained high
operational performance. Our nuclear fleet had one of the
best years in its history, and our fossil plants had their best
year for availability and reliability in 10 years.
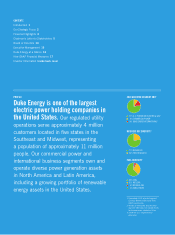
Our commercial businesses include our growing
renewable energy portfolio, our international assets in Latin
America, our competitive fossil generation and retail sales
business in Ohio, and our natural gas generation in the
Midwest. Last year, in total, our commercial businesses
increased both earnings and cash flows.
In our renewables business, we added just over 360 MW
of wind power and ended 2009 with approximately 735 MW
in commercial operation. In Latin America, our 4,000 MW
of highly contracted hydroelectric and gas plants generated
strong cash flows and earnings.
In Ohio, the recession drove down wholesale power
prices, and competitors set out to undercut our locked-in
rates. We met this challenge by launching a strategy to
attract customers seeking competitive suppliers with our
own competitive retail supplier, Duke Energy Retail Sales.
As you would expect, this required us to reduce our margins
in order to retain some of our customers. In 2010, we will
continue our efforts to mitigate customer switching, as
well as position and maximize the value of our Ohio and
Midwest businesses in the wholesale generation market.
With our sizable investments to modernize our energy
infrastructure, capital is our lifeblood. Thanks to our strong
balance sheet, we had remarkable access to the capital
markets. We issued $3.75 billion of fixed-rate debt at an
average 5.2 percent interest rate in 2009. Over the past
two years, we issued more than $7 billion of fixed-rate
debt at favorable rates and terms, and $600 million of equity
through our dividend reinvestment plan (DRIP) and other
internal plans. At year-end, our debt to total capitalization
ratio was 44 percent, and we maintained our investment-
grade corporate credit ratings.
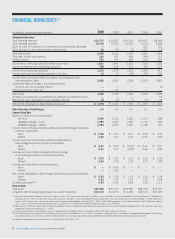
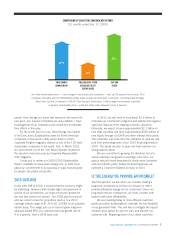
Due to our employees’ extraordinary efforts last year,
we exceeded our 2009 employee incentive target by
2 cents, earning $1.22 per share on an adjusted diluted
basis. Reported diluted earnings per share (EPS) were
83 cents for 2009.
Our total shareholder return — the change in stock
price plus dividends — was up 22 percent for the year.
That compares favorably with the Philadelphia Utility Index
(made up of 20 peer companies, including Duke Energy),
which was up only 10 percent in 2009. Over the past
three years, Duke Energy has achieved a positive 4 percent
shareholder return, while the utility index dropped nearly
5 percent.
Even though our adjusted earnings have been essentially
flat over the last three years, we grew our dividend an average
of approximately 4 percent each year during this period.
The one area where we didn’t meet expectations is
employee and contractor safety. After a fatality-free 2008,
we suffered three contractor deaths in 2009. This reminds
us of the hazards involved in bringing energy to millions of