Duke Energy 2009 Annual Report Download - page 5
Download and view the complete annual report
Please find page 5 of the 2009 Duke Energy annual report below. You can navigate through the pages in the report by either clicking on the pages listed below, or by using the keyword search tool below to find specific information within the annual report.-
 1
1 -
 2
2 -
 3
3 -
 4
4 -
 5
5 -
 6
6 -
 7
7 -
 8
8 -
 9
9 -
 10
10 -
 11
11 -
 12
12 -
 13
13 -
 14
14 -
 15
15 -
 16
16 -
17
-
18
-
19
-
20
-
21
 |
 |

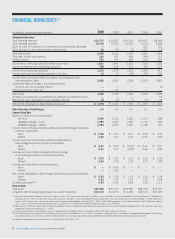
FINANCIAL HIGHLIGHTS( a , b )
4 DUKE ENERGY CORPORATION / 2009 ANNUAL REPORT
(In millions, except per-share amounts) 2009 2008 2007 2006 2005
Statement of Operations
Total operating revenues $12,731 $13,207 $12,720 $10,607 $6,906
Total operating expenses 10,518 10,765 10,222 9,210 5,586
Gains on sales of investments in commercial and multi-family real estate — — — 201 191
Gains (losses) on sales of other assets and other, net 36 69 (5) 223 (55)
Operating income 2,249 2,511 2,493 1,821 1,456
Total other income and expenses 333 121 428 354 217
Interest expense 751 741 685 632 381
Income from continuing operations before income taxes 1,831 1,891 2,236 1,543 1,292
Income tax expense from continuing operations 758 616 712 450 375
Income from continuing operations 1,073 1,275 1,524 1,093 917
Income (loss) from discontinued operations, net of tax 12 16 (22) 783 935
Income before cumulative effect of change in accounting principle
and extraordinary items 1,085 1,291 1,502 1,876 1,852
Cumulative effect of change in accounting principle,
net of tax and noncontrolling interest — — — — (4)
Extraordinary items, net of tax — 67 — — —
Net income 1,085 1,358 1,502 1,876 1,848
Dividends and premiums on redemption of preferred and preference stock — — — — 12
Net income (loss) attributable to noncontrolling interests 10 (4) 2 13 24
Net income attributable to Duke Energy Corporation $ 1,075 $ 1,362 $ 1,500 $ 1,863 $ 1,812
Ratio of Earnings to Fixed Charges 3.0 3.4 3.7 2.6 2.4
Common Stock Data
Shares of common stock outstanding (c)
Year-end 1,309 1,272 1,262 1,257 928
Weighted average — basic 1,293 1,265 1,260 1,170 934
Weighted average — diluted 1,294 1,267 1,265 1,188 970
Income from continuing operations attributable to Duke Energy Corporation
common shareholders
Basic $ 0.82 $ 1.01 $ 1.21 $ 0.92 $ 0.94
Diluted 0.82 1.01 1.20 0.91 0.92
Income (loss) from discontinued operations attributable to
Duke Energy Corporation common shareholders
Basic $ 0.01 $ 0.02 $ (0.02) $ 0.67 $ 1.00
Diluted 0.01 0.01 (0.02) 0.66 0.96
Earnings per share (before cumulative effect of change
in accounting principle and extraordinary items)
Basic $ 0.83 $ 1.03 $ 1.19 $ 1.59 $ 1.94
Diluted 0.83 1.02 1.18 1.57 1.88
Earnings per share (from extraordinary items)
Basic $ — $ 0.05 $ — $ — $ —
Diluted — 0.05 — — —
Net income attributable to Duke Energy Corporation common shareholders
Basic $ 0.83 $ 1.08 $ 1.19 $ 1.59 $ 1.94
Diluted 0.83 1.07 1.18 1.57 1.88
Dividends per share (d) 0.94 0.90 0.86 1.26 1.17
Balance Sheet
Total assets $57,040 $53,077 $49,686 $68,700 $54,723
Long-term debt including capital leases, less current maturities $16,113 $13,250 $ 9,498 $18,118 $14,547
(a) Significant transactions reflected in the results above include: 2009 impairment of goodwill and other assets (see Note 11 to the Consolidated Financial Statements, “Goodwill and
Intangible Assets”), 2007 spinoff of the natural gas businesses (see Note 1 to the Consolidated Financial Statements, “Summary of Significant Accounting Policies”), 2006 merger with
Cinergy, 2006 Crescent joint venture transaction and subsequent deconsolidation effective Sept. 7, 2006, 2005 DENA disposition, 2005 deconsolidation of DCP Midstream effective
July 1, 2005, and 2005 Duke Energy Field Services, LLC (DEFS) sale of Texas Eastern Products Pipeline Company, LLC (TEPPCO).
(b) Periods prior to 2009 have been recast to reflect the adoption of the noncontrolling interest presentation provisions of Accounting Standards Codification 810 – Consolidation, which was
adopted by Duke Energy effective Jan. 1, 2009.
(c) 2006 increase primarily attributable to issuance of approximately 313 million shares in connection with Duke Energy’s merger with Cinergy.
(d) 2007 decrease due to the spinoff of the natural gas businesses to shareholders on Jan. 2, 2007, as dividends subsequent to the spinoff were split proportionately between Duke Energy
and Spectra Energy, such that the sum of the dividends of the two stand-alone companies approximated the former total dividend of Duke Energy prior to the spinoff.
See Notes to Consolidated Financial Statements in Duke Energy’s 2009 Form 10-K.