Dick's Sporting Goods 2008 Annual Report Download - page 2
Download and view the complete annual report
Please find page 2 of the 2008 Dick's Sporting Goods annual report below. You can navigate through the pages in the report by either clicking on the pages listed below, or by using the keyword search tool below to find specific information within the annual report.-
 1
1 -
 2
2 -
 3
3 -
 4
4 -
 5
5 -
 6
6 -
 7
7 -
 8
8 -
 9
9 -
 10
10 -
 11
11 -
 12
12 -
 13
13 -
14
-
15
-
16
-
17
-
18
-
19
-
20
-
21
-
22
-
23
-
24
-
25
-
26
-
27
-
28
-
29
-
30
-
31
-
32
-
33
-
34
-
35
-
36
-
37
-
38
-
39
-
40
-
41
-
42
-
43
-
44
-
45
-
46
-
47
-
48
-
49
-
50
-
51
-
52
-
53
-
54
-
55
-
56
-
57
-
58
-
59
-
60
-
61
-
62
-
63
-
64
-
65
-
66
-
67
-
68
-
69
-
70
-
71
-
72
-
73
-
74
-
75
-
76
-
77
-
78
-
79
-
80
 |
 |

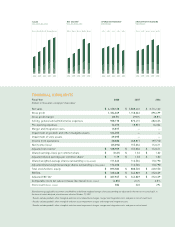
SALES
(DOLLARS IN MILLIONS)
20082007200620052004
$4,130$3,888$3,114$2,625$2,109
NET INCOME1
(DOLLARS IN MILLIONS)
2007200620052004
$155.0$112.6$94.5$74.5
2008
$138.9
2007200620052004
6.9%6.3%6.5%6.2%
2008
5.8%
OPERATING MARGINS2
(PERCENTAGE)
GROSS PROFIT MARGINS
(PERCENTAGE)
20082007200620052004
28.7%29.8%28.8%28.1%27.8%
FINANCIAL HIGHLIGHTS
Fiscal Year 2008 2007 2006
(Dollars in thousands, except per share data)
Net sales $ 4,130,128 $ 3,888,422 $ 3,114,162
Gross profi t 1,184,049 1,158,063 896,699
Gross profi t margin 28.7% 29.8% 28.8%
Selling, general and administrative expenses 928,170 870,415 682,625
Pre-opening expenses 16,272 18,831 16,364
Merger and integration costs 15,877 — —
Impairment of goodwill and other intangible assets 164,255 — —
Impairment of store assets 29,095 — —
Income from operations 30,380 268,817 197,710
Net income (loss) (35,094) 155,036 112,611
Adjusted net income2 $ 138,909 $ 155,036 $ 112,611
Diluted earnings (loss) per common share $ (0.31) $ 1.33 $ 1.02
Adjusted diluted earnings per common share2 $ 1.19 $ 1.33 $ 1.02
Diluted weighted average shares outstanding (in thousands) 111,662 116,504 110,790
Adjusted diluted weighted average shares outstanding (in thousands) 116,650 116,504 110,790
Total stockholders’ equity $ 895,582 $ 888,520 $ 620,550
EBITDA $ 123,468 $ 343,869 $ 252,639
Adjusted EBITDA3 $ 327,947 $ 343,869 $ 252,639
Comparable store net sales increase (decrease) (Dick’s stores) (4.8%) 2.4% 6.0%
Store count (Dick’s stores) 384 340 294
Diluted earnings applicable to common stockholders and diluted weighted average shares outstanding are adjusted for the two-for-one stock split, in
the form of a stock dividend, which became effective October 19, 2007.
1 Results exclude goodwill, other intangible and store asset impairment charges, merger and integration costs, and gain on sale of investment.
2 Results exclude goodwill, other intangible and store asset impairment charges and merger and integration costs.
3 Results exclude goodwill, other intangible and store asset impairment charges, merger and integration costs, and gain on sale of asset.