Citrix 2012 Annual Report Download - page 2
Download and view the complete annual report
Please find page 2 of the 2012 Citrix annual report below. You can navigate through the pages in the report by either clicking on the pages listed below, or by using the keyword search tool below to find specific information within the annual report.-
 1
1 -
 2
2 -
 3
3 -
 4
4 -
 5
5 -
 6
6 -
 7
7 -
 8
8 -
 9
9 -
 10
10 -
 11
11 -
 12
12 -
 13
13 -
14
-
15
-
16
-
17
-
18
-
19
-
20
-
21
-
22
-
23
-
24
-
25
-
26
-
27
-
28
-
29
-
30
-
31
-
32
-
33
-
34
-
35
-
36
-
37
-
38
-
39
-
40
-
41
-
42
-
43
-
44
-
45
-
46
-
47
-
48
-
49
-
50
-
51
-
52
-
53
-
54
-
55
-
56
-
57
-
58
-
59
-
60
-
61
-
62
-
63
-
64
-
65
-
66
-
67
-
68
-
69
-
70
-
71
-
72
-
73
-
74
-
75
-
76
-
77
-
78
-
79
-
80
-
81
-
82
-
83
-
84
-
85
-
86
-
87
-
88
-
89
-
90
-
91
-
92
-
93
-
94
-
95
-
96
-
97
-
98
-
99
-
100
-
101
-
102
-
103
-
104
-
105
-
106
-
107
-
108
-
109
-
110
-
111
-
112
-
113
-
114
-
115
-
116
-
117
-
118
 |
 |

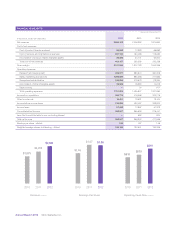
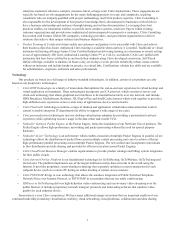
FINANCIAL HIGHLIGHTS
2012 2011 2010
Net revenues 2,586,123 2,206,392 1,874,662
Cost of net revenues:
Cost of product license revenues 96,962 74,393 66,682
Cost of services and maintenance revenues 227,150 164,465 115,080
Amortization of product related intangible assets 80,025 54,741 50,504
Total cost of net revenues 404,137 293,599 232,266
Gross margin 2,181,986 1,912,793 1,642,396
Operating expenses:
Research and development 450,571 380,674 361,376
Sales, marketing and services 1,060,829 885,066 771,660
General and administrative 245,259 213,673 173,394
Amortization of other intangible assets 34,549 16,390 14,279
Restructuring —24 971
Total operating expenses 1,791,208 1,495,827 1,321,680
Income from operations 390,778 416,966 320,716
Other income, net 19,451 13,531 13,104
Income before income taxes 410,229 430,497 333,820
Income taxes 57,682 74,867 57,379
Consolidated net income 352,547 355,630 276,441
Less: Net loss attributable to non-controlling interest —692 624
Total net income 352,547 356,322 277,065
Earnings per share - diluted 1.86 1.87 1.46
Weighted average shares outstanding - diluted 189,129 190,641 190,335
Year ended December 31
In thousands, except per share data
Revenue (millions)
2010 2011 2012
$2,586
$1,875
$2,206
Earnings Per Share
2010 2011 2012
$1.86
$1.46
$1.87
Operating Cash Flow (millions)
2010 2011 2012
$819
$616 $679
Annual Report 2012 Citrix Systems, Inc.