Chesapeake Energy 1998 Annual Report Download - page 5
Download and view the complete annual report
Please find page 5 of the 1998 Chesapeake Energy annual report below. You can navigate through the pages in the report by either clicking on the pages listed below, or by using the keyword search tool below to find specific information within the annual report.-
 1
1 -
 2
2 -
 3
3 -
 4
4 -
 5
5 -
 6
6 -
 7
7 -
 8
8 -
 9
9 -
 10
10 -
 11
11 -
 12
12 -
 13
13 -
 14
14 -
 15
15 -
 16
16 -
17
-
18
-
19
-
20
-
21
-
22
-
23
-
24
-
25
-
26
-
27
-
28
-
29
-
30
-
31
-
32
-
33
-
34
-
35
-
36
-
37
-
38
-
39
-
40
-
41
-
42
-
43
-
44
-
45
-
46
-
47
-
48
-
49
-
50
-
51
-
52
-
53
-
54
-
55
-
56
-
57
-
58
-
59
-
60
-
61
-
62
-
63
-
64
-
65
-
66
-
67
-
68
-
69
-
70
-
71
-
72
-
73
-
74
-
75
-
76
-
77
-
78
-
79
-
80
-
81
-
82
-
83
-
84
-
85
-
86
-
87
-
88
-
89
-
90
-
91
-
92
-
93
-
94
-
95
-
96
-
97
-
98
-
99
-
100
-
101
-
102
-
103
-
104
-
105
 |
 |

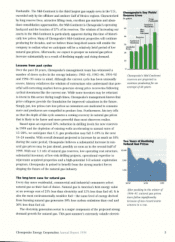
$2.1 billion (pro forma for acquisitions) as of January 1, 1997 to $661 million as
of December 31, 1998, leading to significant asset writedowns in 1998 and 1997.
An important feature of how we built our long-life gas reserve base is that we
used long-term capital. We have no net bank debt and our earliest senior debt
maturity is in 2004. Even at today's unusually low oil and gas prices, we have
sufficient cash flow to pay interest on our debt and fund a capital program suffi-
cient to maintain our reserve base. We are confident Chesapeake has enough
staying power to wait for the eventual turnaround in prices, which should lead
to a dramatic increase in the value of our oil and gas assets.
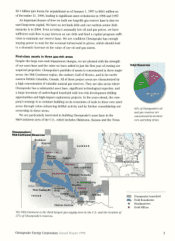
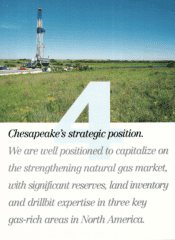
First-class assets in three gas-rich areas
Despite the large non-cash impairment charges, we are pleased with the strength
of our asset base and the value we have added in just the first year of owning our
acquired properties. Chesapeake's portfolio of assets is concentrated in three major
areas: the Mid-Continent region, the onshore Gulf of Mexico, and in far north-
eastern British Columbia, Canada. AJ1 of these project areas are characterized by
a high concentration of valuable natural gas reserves. They are also areas where
Chesapeake has a substantial asset base, significant technological expertise, and
a large inventory of undeveloped leasehold with low-risk development drilling
opportunities and high-impact exploratory projects. In the years ahead, the com-
pany's strategy is to continue building on its economies of scale in these core asset
areas through value-enhancing drillbit activity and by further consolidating our
ownership in these areas.
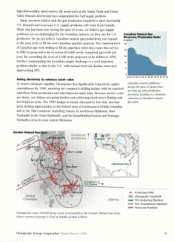
We are particularly interested in building Chesapeake's asset base in the
Mid-Continent area of the U.S., which includes Oklahoma, Kansas and the Texas
Chesapeake's
Mid-Continent Reserves
Bradshaw
Hugoton
Mocane-
Laverne
/,
Fritch /
West Panhandle
TEXAS
KANSAS
Sahara
OKLAHOMA
Watonga/Chickasha
* Okiar City
Bradley
Anadarko Lleds
Deep /_Golden
Cement /Trend
Knox
Sholem-Alechem
/
Caddo-Springer
Arkoma
The Mid-Continent is the third largest gas supply area in the U.S. and the location of
57% of Chesapeake's reserves.
Total Reserves
92% of Chesapeake's oil
and gas reserves are
concentrated in its three
core operating areas.
Chesapeake Leasehold
Field Boundaries
*Headquarters
Field Offices
Chesapeake Energy Corporation Annual Report 1998 3