Chesapeake Energy 1998 Annual Report Download - page 11
Download and view the complete annual report
Please find page 11 of the 1998 Chesapeake Energy annual report below. You can navigate through the pages in the report by either clicking on the pages listed below, or by using the keyword search tool below to find specific information within the annual report.-
 1
1 -
 2
2 -
 3
3 -
 4
4 -
 5
5 -
 6
6 -
 7
7 -
 8
8 -
 9
9 -
 10
10 -
 11
11 -
 12
12 -
 13
13 -
 14
14 -
 15
15 -
 16
16 -
 17
17 -
 18
18 -
 19
19 -
 20
20 -
 21
21 -
 22
22 -
23
-
24
-
25
-
26
-
27
-
28
-
29
-
30
-
31
-
32
-
33
-
34
-
35
-
36
-
37
-
38
-
39
-
40
-
41
-
42
-
43
-
44
-
45
-
46
-
47
-
48
-
49
-
50
-
51
-
52
-
53
-
54
-
55
-
56
-
57
-
58
-
59
-
60
-
61
-
62
-
63
-
64
-
65
-
66
-
67
-
68
-
69
-
70
-
71
-
72
-
73
-
74
-
75
-
76
-
77
-
78
-
79
-
80
-
81
-
82
-
83
-
84
-
85
-
86
-
87
-
88
-
89
-
90
-
91
-
92
-
93
-
94
-
95
-
96
-
97
-
98
-
99
-
100
-
101
-
102
-
103
-
104
-
105
 |
 |

high-deliverability, short-reserve life areas such as the Austin Chalk and Cotton
Valley Pinnacle Reef trends has compounded the Gulf supply problem.
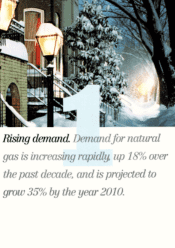
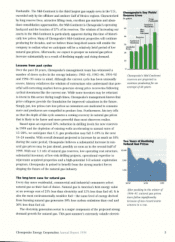
Many investors believe that the gas production required to meet increasing
U.S. demand and overcome U.S. supply problems will come from Canada.
While this has been true during the past 10 years, we believe gas supply
problems are as challenging for the Canadian industry as they are for U.S.
producers. We do not believe Canadian natural gas productivity can expand
in the near term to fill the new Canadian pipeline projects. The required level
of Canadian gas well drilling to fill the pipelines when they come into service
in 2001 is projected to be in excess of 8,000 newly completed gas wells per
year, far exceeding the level of 4,500 wells projected to be drilled in 1999.
Further compounding the Canadian supply challenge is a well depletion
problem similar to that in the U.S., with annual reservoir decline rates now
approaching 20%.
Acting decisively to enhance asset value
To ensure adequate liquidity, Chesapeake has significantly reduced its capital
expenditures for 1999, matching the company's drilling budget with its expected
cash flows from production and miscellaneous asset sales. Because service costs
are down, our dollars are going further and achieving much lower finding and
development costs. The 1999 budget is mostly allocated to low-risk, develop-
ment drilling opportunities in the Helmet area of northeastern British Colombia
and in the Mid-Continent, including Sahara in northwest Oklahoma, West
Panhandle in the Texas Panhandle, and the Knox/Bradley/Cement and Watonga-
Chickasha areas in west central Oklahoma.
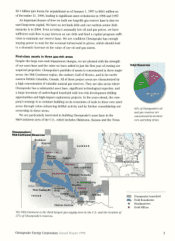
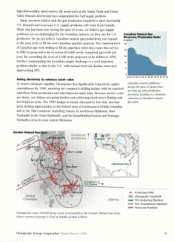
Greater Helmet Gas Area Northwest
IqWINT Territories
kS S I T L
British
Columbia
JULY LAKE
I
HELMET
to Eastern us.
Gas Markets -*
Alberta
Chesapeake owns 700,000 gross acres of leasehold in the Greater Helmet Gas Area,
where reserves average 6.0 bcf at depths of only 4,500 ft.
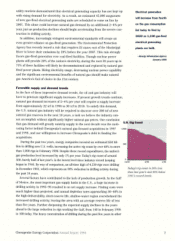
Canadian Natural Gas
Reserves/Production Ratio
in years
40
32
24
16
8
085 86 87 88 89 90 91 9293 9495 96 97 98
Canadian reserve additions
during the past 15 years have
not kept up with production
increases, leading to a dramatic
reduction in Canada's reserve
life index.
Producing Wells
T1 Chesapeake Leasehold
NCL Gathering Pipelines
NCL Transmission Pipelines
Westcoast Pipelines
Chesapeake Energy Corporation Annual Report 1998 9