Chesapeake Energy 1998 Annual Report Download - page 2
Download and view the complete annual report
Please find page 2 of the 1998 Chesapeake Energy annual report below. You can navigate through the pages in the report by either clicking on the pages listed below, or by using the keyword search tool below to find specific information within the annual report.-
 1
1 -
 2
2 -
 3
3 -
 4
4 -
 5
5 -
 6
6 -
 7
7 -
 8
8 -
 9
9 -
 10
10 -
 11
11 -
 12
12 -
 13
13 -
14
-
15
-
16
-
17
-
18
-
19
-
20
-
21
-
22
-
23
-
24
-
25
-
26
-
27
-
28
-
29
-
30
-
31
-
32
-
33
-
34
-
35
-
36
-
37
-
38
-
39
-
40
-
41
-
42
-
43
-
44
-
45
-
46
-
47
-
48
-
49
-
50
-
51
-
52
-
53
-
54
-
55
-
56
-
57
-
58
-
59
-
60
-
61
-
62
-
63
-
64
-
65
-
66
-
67
-
68
-
69
-
70
-
71
-
72
-
73
-
74
-
75
-
76
-
77
-
78
-
79
-
80
-
81
-
82
-
83
-
84
-
85
-
86
-
87
-
88
-
89
-
90
-
91
-
92
-
93
-
94
-
95
-
96
-
97
-
98
-
99
-
100
-
101
-
102
-
103
-
104
-
105
 |
 |

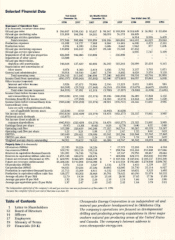
Selected Financial Data
Table of Contents
1Letter to Shareholders
12 Board of Directors
14 Officers
17 Employees
18 Glossary of Terms
19 Financials (10-K)
*An independent appraisal of the company's oil and gas reserves was not performed as of December 31, 1996,
because the company tfiscal year.end at that time was June 30.
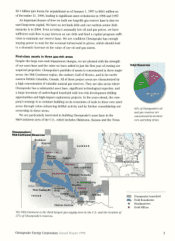
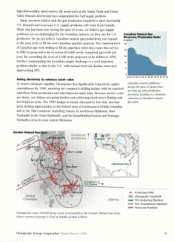
Chesapeake Energy Corporation is an independent oil and
natural gas producer headquartered in Oklahoma City.
The company's operations are focused on developmental
drilling and producing property acquisitions in three major
onshore natural gas producing areas ofthe United States
and Canada. The company's Internet address is
www. chesapeake-energy. com.
Year Ended
December 31, Six Months Ended
December 31, Year Ended June 30,
1998 1997 1997 1996 1997 1996 1995 1994
Statement of Operations Data
($ in thousands, except per share data)
Oil and gas sales $ 256,887 $198,410 $ 95,657 $ 90,167 $ 192,920 $110,849 $ 56,983 $ 22,404
Oil and gas marketing sales 121,059 104,394 58,241 30,019 76,172 28,428
Oil and gas service operations ----6,314 8,836 6,439
Total revenues 377,946 302,804 153,898 120,186 269,092 145,591 65,819 28,843
Production expenses 51.202 14,737 7,560 4,268 11,445 6,340 3,379 2,141
Production taxes 8,295 4,590 2,534 1,606 3,662 1,963 877 1,506
Oil and gas marketing expenses 119,008 103,819 58,227 29,548 75,140 27,452
Oil and gas service operations ----4,895 7,747 5,199
Impairment of oil and gas properties 826,000 346,000 110,000 236,000
Impairment of other assets 55,000
Oil and gas depreciation,
depletion and amortization 146,644 127,429 60,408 36,243 103,264 50,899 25,410 8,141
Depreciation and amortization of
other assets 8,076 4,360 2,414 1,836 3,782 3,157 1,765 1,871
General and administrative 19,918 10,910 5,847 3,739 8,802 4,828 3,578 3,135
Total operating costs 1,234,143 611,845 246,990 77,240 442,095 99,534 42,756 21,993
Income (loss) from operations (856,197) (309,041) (93,092) 42,946 (173,003) 46,057 23,063 6,850
Other income (expense):
Interest and other income 3,926 87,673 78,966 2,516 11,223 3,831 1,524 981
Interest expense (68,249) (29,782) (17,448) (6,216) (18,550) (13,679) (6,627) (2,676)
Total other income (expense) (64,323) 57,891 61,518 (3,700) (7,327) (9,848) (5,103) (1,695)
Income (loss) before income taxes
and extraordinary item (920,520) (251,150) (31,574) 39,246 (180,330) 36,209 17,960 5,155
Provision (benefit) for income taxes (17,898) 14,325 (3,573) 12,854 6,299 1,250
Income (loss) before extraordinary item (920,520) (233,252) (31,574) 24,921 (176.757) 23,355 11,661 3,905
Extraordinary item:
Loss on early extinguishment of debt,
net of applicable income taxes (13,334) (177) (6,443) (6,620)
Net income (loss) (933,854) (233,429) (31,574) 18,478 (183,377) 23,355 11,661 3,905
Preferred stock dividends (12,077) --
Net income (loss) available to
coimnon shareholders (945,931) (233,429) (31,574) 18.478 (183,377) 23,355 11,661 3,905
Earniligs (loss) per share (9.97) (3.30) (0.45) 0.28 (2.79) 0.40 0.21 0.08
Operating cash flow 115,200 226,639 141,248 77,325 162,716 90.265 45,135 15,167
Operating cash flow per share 1.21 3.21 1.99 1.17 2.47 1.55 0.81 0.31
EBITDA 183,449 256,421 158,696 83,541 181,266 103,944 51,762 17,843
EBITDA per share 1.93 3.63 2.24 1.26 2.76 1.78 0.93 0.37
Weighted average shares outstanding 94,911 70,672 70,835 66,300 65,767 58,342 55,872 48,240
Property Data ($ in thousands)
Oil reserves (MBbls) 22,593 18,226 18,226 *17,373 12,258 5,116 4,154
Gas reserves (MMcf) 955,791 339,118 339,118 *298,766 351,224 211,808 117,066
Reserves in equivalent thousand barrels 181,891 74,746 74,746 *67,167 70,795 40,417 23,665
Reserves in equivalent million cubic feet 1,091,348 448,474 448,474 *403,004 424,775 242,505 141,992
Future net revenues discounted at 10% $ 660,991 $466,509 $466,509 $*$ 437,386 $547,016 $188,137 $141,249
Future net revenues undiscounted $1,208,641 $715,098 $715,098 $*$ 611,954 $795,600 $274,900 $209,795
Oil production (MBbls) 5,976 3,511 1,857 1,116 2,770 1,413 1,139 537
Gas production (MMcf) 94,421 59,236 27,326 30,095 62,005 51,710 25,114 6,927
Production in equivalent thousand barrels 21,713 13,384 6,411 6,132 13,104 10,031 5,325 1,692
Production in equivalent million cubic feet 130,277 80,302 38,468 36,791 78,625 60,190 31,974 10,152
Average oil price ($ per Bbl) 12.70 19.39 18.59 21.88 20.93 17.85 17.36 15.09
Average gas price ($ per McI) 1.92 2.20 2.24 2.18 2.18 1.66 1.48 2.06
Average gas equivalent price ($ per Mcfe) 1.97 2.47 2.49 2.45 2.45 1.84 1.78 2.21