Cemex 1999 Annual Report Download - page 5
Download and view the complete annual report
Please find page 5 of the 1999 Cemex annual report below. You can navigate through the pages in the report by either clicking on the pages listed below, or by using the keyword search tool below to find specific information within the annual report.-
 1
1 -
 2
2 -
 3
3 -
 4
4 -
 5
5 -
 6
6 -
 7
7 -
 8
8 -
 9
9 -
 10
10 -
 11
11 -
 12
12 -
 13
13 -
 14
14 -
 15
15 -
 16
16 -
17
-
18
-
19
-
20
-
21
-
22
-
23
-
24
-
25
-
26
-
27
-
28
-
29
-
30
-
31
-
32
-
33
-
34
-
35
-
36
-
37
-
38
-
39
-
40
-
41
-
42
-
43
-
44
-
45
-
46
-
47
-
48
-
49
-
50
-
51
-
52
-
53
-
54
-
55
-
56
-
57
-
58
-
59
-
60
-
61
-
62
-
63
-
64
-
65
-
66
-
67
-
68
-
69
-
70
-
71
-
72
-
73
-
74
-
75
 |
 |

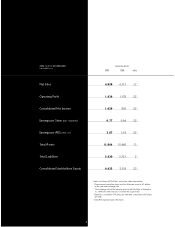
CEMEX,S.A.DE C.V.AND SUBSIDIARIES MILLIONS OF US DOLLARS*
AS OF DECEMBER 31,1999 %
1999 1998 CHANGE
Net Sales 4,828 4,315 12
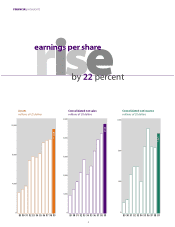
Operating Profit 1,436 1,178 22
Consolidated Net Income 1,029 843 22
Earnings per Share (BMV: CEMEXCPO)10.77 0.64 22
Earnings per ADS (NYSE: CX)23.87 3.18 22
Total Assets 11,864 10,460 13
Total Liabilities 5,430 5,321 2
Consolidated Stockholders’ Equity 6,435 5,138 25
3
Data in millions of US dollars, except per-share information
*Convenience translation from constant Mexican pesos to US dollars
at the year-end exchange rate.
The exchange rate of the Mexican peso to the US dollar at December
31, 1999 and 1998, was $9.51 and $9.90, respectively.
1Based on 1.256 billion CPO shares for 1999 and 1.262 billion CPO shares
for 1998.
2Each ADS represents five CPO shares.