Cemex 1999 Annual Report Download - page 4
Download and view the complete annual report
Please find page 4 of the 1999 Cemex annual report below. You can navigate through the pages in the report by either clicking on the pages listed below, or by using the keyword search tool below to find specific information within the annual report.-
 1
1 -
 2
2 -
 3
3 -
 4
4 -
 5
5 -
 6
6 -
 7
7 -
 8
8 -
 9
9 -
 10
10 -
 11
11 -
 12
12 -
 13
13 -
 14
14 -
 15
15 -
16
-
17
-
18
-
19
-
20
-
21
-
22
-
23
-
24
-
25
-
26
-
27
-
28
-
29
-
30
-
31
-
32
-
33
-
34
-
35
-
36
-
37
-
38
-
39
-
40
-
41
-
42
-
43
-
44
-
45
-
46
-
47
-
48
-
49
-
50
-
51
-
52
-
53
-
54
-
55
-
56
-
57
-
58
-
59
-
60
-
61
-
62
-
63
-
64
-
65
-
66
-
67
-
68
-
69
-
70
-
71
-
72
-
73
-
74
-
75
 |
 |

2
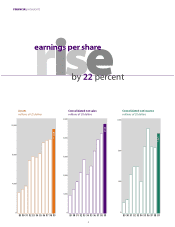
rise
earnings per share
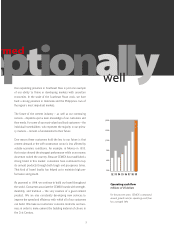
89 90 91 92 93 94 95 96 97 98 99 89 90 91 92 93 94 95 96 97 98 99 89 90 91 92 93 94 95 96 97 98 99
Assets
millions of US dollars
Consolidated net sales
millions of US dollars
Consolidated net income
millions of US dollars
11,864
4,828
1,029
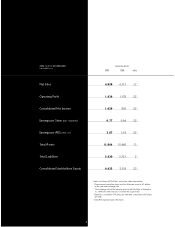
FINANCIAL HIGHLIGHTS
by 22 percent
12,000
8,000
4,000
0
1,200
800
400
0
5,000
4,000
1,000
3,000
2,000
0