Build-A-Bear Workshop 2012 Annual Report Download - page 6
Download and view the complete annual report
Please find page 6 of the 2012 Build-A-Bear Workshop annual report below. You can navigate through the pages in the report by either clicking on the pages listed below, or by using the keyword search tool below to find specific information within the annual report.-
 1
1 -
 2
2 -
 3
3 -
 4
4 -
 5
5 -
 6
6 -
 7
7 -
 8
8 -
 9
9 -
 10
10 -
 11
11 -
 12
12 -
 13
13 -
 14
14 -
 15
15 -
 16
16 -
 17
17 -
18
-
19
-
20
-
21
-
22
-
23
-
24
-
25
-
26
-
27
-
28
-
29
-
30
-
31
-
32
-
33
-
34
-
35
-
36
-
37
-
38
-
39
-
40
-
41
-
42
-
43
-
44
-
45
-
46
-
47
-
48
-
49
-
50
-
51
-
52
-
53
-
54
-
55
-
56
-
57
-
58
-
59
-
60
-
61
-
62
-
63
-
64
-
65
-
66
-
67
-
68
-
69
-
70
-
71
-
72
-
73
-
74
-
75
-
76
-
77
-
78
 |
 |

2
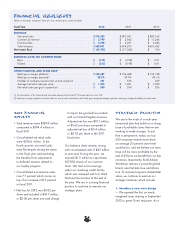
2012 Financial
Re s u lts
• Total revenues were $380.9 million
compared to $394.4 million in
fiscal 2011.
• Consolidated net retail sales
were $374.6 million. In the
fourth quarter, net retail sales
were flat despite closing ten stores
in the fiscal year and excluding
the benefits from adjustments
to deferred revenue related to
our loyalty program.
• Consolidated e-commerce sales
rose 7.7 percent which comes on
top of an increase of 8.5 percent
in fiscal 2011.
• Net loss for 2012 was $3.02 per
share and included a $33.7 million,
or $2.06 per share non-cash charge
to impair the goodwill associated
with our United Kingdom business.
Adjusted net loss was $10.1 million,
or $0.62 per share compared to
adjusted net loss of $0.4 million
or $0.03 per share in the 2011
fiscal year.
Our balance sheet remains strong
with consolidated cash of $45 million
at year end. During the year, we
invested $1.3 million to repurchase
367,000 shares of our common
stock. We had no borrowings
under our revolving credit facility
which was renewed with U.S. Bank
National Association at the end of
the year. We are in a strong financial
position to continue to execute our
strategic plans.
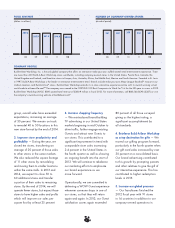
Strategic Priorities
We are in the midst of a multi-year
turnaround plan that builds on a strong
base of profitable stores that we are
working to make stronger. To put
that in perspective, today our top
200 company-owned stores have
an average 20 percent store level
contribution, and we believe our store
base will be more profitable by the
end of 2014 as we benefit from our key
initiatives. Importantly, Build-A-Bear
Workshop remains a powerful global
brand, one that kids love and Moms
trust. To increase long term shareholder
value, we continue to execute our
strategic initiatives which include:
1. Introduce a new store design
— We opened the first six newly
imagined stores starting in September
2012 to great Guest response. As a
Financial Highlights
(dollars in thousands, except per share, per store, and per gross square foot data)
Fiscal Year 2012 2011 2010
REVENUES
Net retail sales .................................... $ 374,553 $ 387,041 $ 387,163
Commercial revenue ................................ $ 2,790 $ 3,943 $ 11,246
Franchise fees..................................... $ 3,598 $ 3,391 $ 3,043
Total revenues..................................... $ 380,941 $ 394,375 $ 401,452
Net income (loss) .................................... $ (49,295) $ (17,062) $ 104
EARNINGS (LOSS) PER COMMON SHARE
Basic .......................................... $ (3.02) $ (0.98) $ 0.01
Diluted .......................................... $ (3.02) $ (0.98) $ 0.01
OTHER FINANCIAL AND STORE DATA(1)
Retail gross margin (dollars)(2) .......................... $ 145,687 $ 154,468 $ 155,128
Retail gross margin (percent)(2).......................... 38.9% 39.9% 40.1%
Number of company-owned stores at end of period .......... 351 356 359
Average net retail sales per store ....................... $ 1,003 $ 1,021 $ 1,030
Net retail sales per gross square foot .................... $ 350 $ 354 $ 356
(1) For descriptions of this financial and store data, please see the fiscal 2012 annual report on Form 10-K.
(2) Retail gross margin represents net retail sales less cost of retail merchandise sold. Retail gross margin percentage represents retail gross margin divided by net retail sales.