Bank of Montreal 1999 Annual Report Download - page 5
Download and view the complete annual report
Please find page 5 of the 1999 Bank of Montreal annual report below. You can navigate through the pages in the report by either clicking on the pages listed below, or by using the keyword search tool below to find specific information within the annual report.-
 1
1 -
 2
2 -
 3
3 -
 4
4 -
 5
5 -
 6
6 -
 7
7 -
 8
8 -
 9
9 -
 10
10 -
 11
11 -
 12
12 -
 13
13 -
 14
14 -
 15
15 -
 16
16 -
17
-
18
-
19
-
20
-
21
-
22
-
23
-
24
-
25
-
26
-
27
-
28
-
29
-
30
-
31
-
32
-
33
-
34
-
35
-
36
-
37
-
38
-
39
-
40
-
41
-
42
-
43
-
44
-
45
-
46
-
47
-
48
-
49
-
50
-
51
-
52
-
53
-
54
-
55
-
56
-
57
-
58
-
59
-
60
-
61
-
62
-
63
-
64
-
65
-
66
-
67
-
68
-
69
-
70
-
71
-
72
-
73
-
74
-
75
-
76
-
77
-
78
-
79
-
80
-
81
-
82
-
83
-
84
-
85
-
86
-
87
-
88
-
89
-
90
-
91
-
92
-
93
-
94
-
95
-
96
-
97
-
98
-
99
-
100
-
101
-
102
-
103
-
104
-
105
-
106
-
107
-
108
-
109
-
110
-
111
-
112
 |
 |
Bank of Montreal Group of Companies 1999 Annual Report 3
Now even allowing for the selectivity of nostalgia,
there is no question that over the years since then a
very regrettable thing has happened to banking in
Canada. As banking has evolved far beyond cashing
cheques and taking deposits into the multi-channel,
technology-driven provision of a complex array
of financial products and services, this strong con-
nection with the customer has eroded.
In fact, by the time the nineties began, Canada’s
banks, ours among them, had used up all the instinc-
tive
goodwill most customers could manage.
We have all talked a good story about improving
customer relationships, and to a greater or lesser
extent, we have all meant what we said —we cer-
tainly did here at Bank of Montreal. The problem
has been in the execution.
There are many legitimate reasons for our lack
of success in retaining customers’ goodwill, but
it’s the result that counts, and the result is that few
people look on any bank with a great deal of
affection these days. And this causes considerable
distress to my thousands of dedicated colleagues
as they go about their daily business.
Restaking Our Claim as “My Bank”
After I was appointed Chief Executive Officer
this past February, those bus ads from the sixties
kept pushing back into my consciousness,
reminding me of what really counts in building
a bank for our time.
Throughout the year, my colleagues and I made
the changes and put the strategies in place to make
Bank of Montreal feel like “my bank” to our stake-
holders again. Highlighting and driving home our
intentions, we even adopted “my bank” as the tag
line for our latest advertising campaign.
In order to get back in touch with our customers,
in April we completed the reorganization of our
businesses to align them with our major client seg-
ments. By June, we had grouped interdependent
lines of business into our three main operating
groups. This massive reorganization (see “Enterprise
Accomplishments —A Year of Transition,” page 4)
redirected leadership accountability in 20 of our
32 lines of business, all in the name of remaking
ourselves as a client-focused company.
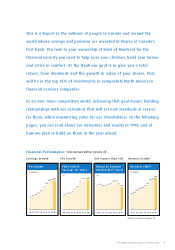
Financial Performance
While completing our transformation into a
client-focused organization in 1999, we also got on
with the business of maximizing value to our
millions of owners —working toward our financial
performance goal of ranking among the top 25%
of comparable companies in North America.
With 1999 net income of $1,382 million, earnings
increased $32 million from the previous year due
to business growth and improved capital market
conditions, offset in part by a return to a higher,
more normal level of provision for credit losses
and by one-time charges. Earnings before the
one-time charges were $1,495 million, an increase
of $145 million or 10.8% from the prior year.
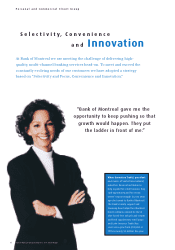
...companies that score high in
shareholder value creation
also score
high in employee and client satisfaction
On a reported basis, f
ully diluted earnings per
share of $4.72 were up from last year’s $4.66. Return
on equity was 14.1%
—
above 14% for the tenth
consecutive year. We are the only bank in our North
American peer group to have achieved this consis-
tency. Our primary success measure, five-year Total
Shareholder Return (the increase in market value
per share plus dividends) reached 22%, exceeding
the Toronto Stock Exchange 300 Com
posite Index
by8.8%overthesameperiod.
(A detailed report
on our financial performance begins on page 20.)
In 1999, we also began to redeploy our people,
capital, technology and other resources to priority
businesses, defined by their collective
potential to
maximize shareholder value through
both organic
growth and acquisitions or alliances.
Personal and Commercial Client Group
Within our Personal and Commercial Client Group,
where we generate more than two-thirds of total
annual income, and where 61% of customers
now
use more than one banking channel, the priority
is to create a seamless client experience regardless
of access channel.
We are also targeting high-opportunity growth
markets. In Canada we are allocating additional
resources to lines of business serving small